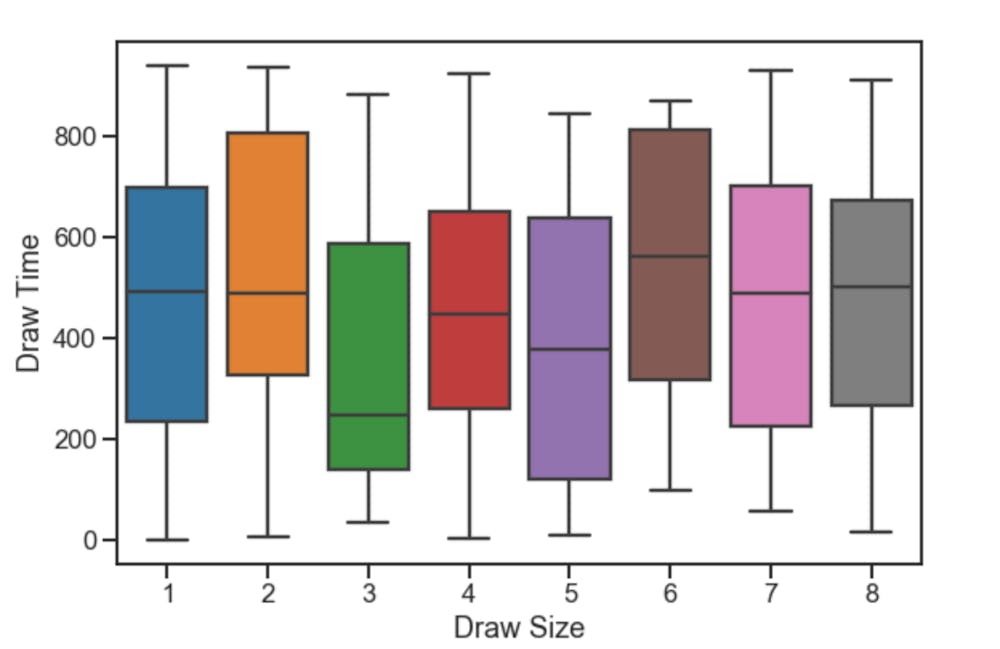
group size vs. draw time.png Box plot showing the distribution of draw times per group size. Photo courtesy of Yang Song ’20
As college sports boom, Princeton’s athletics director says ‘our model is far from broken’ Hayk Yengibaryan
No. 1 men’s lacrosse beats Penn State 14–10 to return to Final Four for the first time since 2022 Hayk Yengibaryan
With 2001 champions watching, No. 1 men’s lacrosse chases a return to the title game Hayk Yengibaryan
Enzo Kho ’26 announced as next Young Alumni Trustee, service and giving emphasized at Alumni Council meeting Haeon Lee
 Solutions by The State News


