


The women’s basketball team is enjoying its best season in program history, as the Tigers are off to a 21-2 start and have won all nine of their Ivy League contests by double digits. Since the conference season is past its halfway point, each team has played each other at least once. This provides an excellent opportunity to compare how each team has performed to this point and to find out how exactly Princeton has been dominating its opponents.
Let’s take a look at some advanced statistics, which are based on how many possessions a team has in each game. These per-possession or pace-adjusted stats are gaining traction in the basketball community and have become favorites for many analysts. The theory behind using per-possession statistics is that, in any given game, each team will have the same number of possessions (give or take one, depending on the end-of-half situations).
Per-possession stats provide a better measuring stick than per-game metrics because they adjust for the pace at which a team plays. For an example of why per-possession stats are so useful, take a look at two men’s teams from last year that you may be familiar with: the University of North Carolina Tar Heels and the Princeton Tigers.
As you probably remember, UNC eventually rolled to the NCAA championship, but it allowed 72.0 points per game along the way, causing some analysts to point to its defense as a weakness. You may also recall, however, that the Tar Heels were notorious for playing at a frantic pace, taking advantage of their athleticism at all five positions. In fact, the Tar Heels averaged 75.7 possessions per game, fifth in the nation and almost 10 full possessions more than the Division I average. UNC’s defense allowed just .951 points per possession, 43rd in the country and well below the national average of 1.011.
In contrast, the Princeton men have historically played a very deliberate style of basketball, and last year was no exception. They allowed only 57.2 points per game last year — fourth in the nation — and their defense garnered tremendous praise. But that average was substantially affected by their slow pace of play. The Tigers averaged just 58.9 possessions per game; only five teams played slower. Adjusted for tempo, Princeton allowed .971 points per possession — still in the top 100 for Division I teams, but not nearly as impressive as its per-game average.
This brings me to my point: UNC allowed almost 15 more points per game than Princeton. But that was entirely an effect of their respective paces of play — the Tar Heels actually allowed fewer points per possession. Even without adjusting for strength of opponent, UNC’s defense played better than Princeton’s last year: On any given trip down the court, the opposing offense would be expected to score fewer points.
Now that we have an example of why it can be useful to look at pace-adjusted stats, let’s turn to Ivy League women’s basketball. To keep the schedules balanced and make better comparisons, all stats are as of Feb. 13, at which point every team had faced each other exactly once (except for travel partners Brown/Yale and Cornell/Columbia, who had each played the other twice).
There is relatively little variance in pace within the Ivy League this year; all teams are within four possessions per game of the league average. The Tigers rank sixth in the league, at 65.6 possessions per game, and the league average is 68.3. The fastest paced teams are Columbia and Yale, while the slowest are Penn and Dartmouth.

With little variance in pace, the efficiency ratings more or less conform to popular belief. Not surprisingly, the Tigers lead by healthy margins in both offensive efficiency and defensive efficiency. Princeton’s offense averages 1.08 points per possession (PPP) in league play, a tremendous rating for a women’s team — the next-best mark belongs to Harvard, a full .12 PPP below. The Tiger defense has held opponents to just .73 PPP, also well clear of the field.
Combining these two measures, we can find that Princeton outscores its opponents by a remarkable .34 points per possession. For comparison’s sake, the top team in men’s basketball this season by that metric (all games included) is Kansas, who outscores its opponents by .28 PPP. In fact, the Tigers’ worst single-game offensive efficiency in league play (.85 PPP at Yale) is better than the best they have allowed (.84 at Columbia).
One clear takeaway from these rankings is that Harvard is the top challenger to the Tigers. The Crimson led Columbia and Yale by just half a game in the standings as of the time these statistics were compiled (they have since extended the gap), but it ranks a clear second in both offensive and defensive efficiency, giving it a combined .11 PPP advantage over the rest of the league. Princeton won its first meeting by 19 points, but the rematch will be the most likely place for the Tigers to falter, especially because Harvard is 10-0 this year at home.
A somewhat surprising rating revealed by the pace-adjusted statistics belongs to defending league champion Dartmouth’s defense. The Big Green ranks third in points allowed per game by a healthy margin, at just 56.7 per contest, but also plays at one of the league’s slowest tempos. When adjusted for pace, it ranks sixth in points allowed per possession (though there is essentially a four-way tie for third).
We can delve even deeper into the numbers to figure out how Princeton has so thoroughly dominated the league on both ends of the court. To do this, let’s take a look at what basketball analysis pioneer Dean Oliver termed the “Four Factors”. The theory behind four-factors analysis is that everything a team does on offense can be boiled down to four categories: shooting from the floor, avoiding turnovers, getting offensive rebounds and earning/making free throws. A team’s defense can be measured the same way, by looking at how well it prevents the opposing team from doing those four things.
Somewhat surprisingly for a team that leads the league in offensive efficiency by .12 PPP, the Tigers top the Ivy League in only one of the offensive four factors: turnover rate. But they do so by a very impressive margin. The Tigers turn the ball over on fewer than 20 percent of their offensive possessions; the next-best team in that category is Harvard, at 24.6 percent. In fact, the difference between Princeton and second-place Harvard is only slightly less than the difference between the Crimson and last-place Cornell (29.9 percent). Freshman point guard Lauren Polansky deserves a lot of credit, as the rookie averages just 2.7 turnovers per 40 minutes this season, an extremely low number for a starting point guard. Sophomore point guard Laura Johnson has performed admirably as well, turning the ball over just 3.5 times in the same time frame.

Harvard and Princeton also top the league in making shots. The two teams are separated by only three-tenths of a point in raw field-goal percentage, but Harvard attempts more three-pointers and makes a league-high 6.5 triples per game. Effective field goal percentage (eFG) takes this disparity into account, by appropriately weighing made three-pointers more than twos. By this metric, Harvard leads the Ivy League at 50.1 percent, with Princeton in second at 48.6 percent, seven percentage points above the league average.
Individually, the Tigers’ top four offensive players are all very efficient shooters. Sophomore center Devona Allgood leads the league by a large margin in field-goal percentage at 61.3 percent, and also rates first in eFG, even though she has not made a single three-pointer. Freshman forward Niveen Rasheed also makes more than half her shots, and both junior guard Addie Micir and sophomore guard Lauren Edwards have an eFG greater than 50 due to their potent long-range shooting.
Princeton also ranks second in offensive rebound percentage, grabbing 42 percent of its own misses. Dartmouth is the only stronger team on the offensive glass, as the Big Green collects 45 percent of the available offensive rebounds — the Ivy League average is 37 percent. Rebound percentage is a better measuring stick of a team’s rebounding abilities than the raw rebounding margin, because it accounts for the fact that teams do not have the same number of offensive and defensive rebound opportunities. Defensive rebounds are easier to get, so a team that misses a lot of shots will allow the other team to have more defensive rebound opportunities, which will depress its rebounding margin.
The final factor is free-throw rate, which can be defined as foul shots per field-goal attempt. This is the lone factor in which the Tigers are below average, as Princeton makes just .17 FT/FGA; the league average is .20, and only Harvard ranks worse. Dartmouth tops the list with .28 FTM/FGA, with Yale rating a clear second.
Defensively, Princeton leads the league in three of the four factors. Perhaps the most impressive statistic is its eFG allowed. The Tigers have held Ivy League opponents to just a 36.1 eFG, and they have been extremely consistent. How great is the gap in shooting between Princeton and its opponents? The Tigers have a season eFG of 49.8, a greater mark than they have allowed in any single game this year (American University performed the best, with a 47.8 eFG).
Princeton also ranks first in defensive rebound percentage and in opponents’ free-throw rate. It is the latter that is somewhat surprising, because before the league season began, allowing free throws was actually something of a weakness for the Tigers. In non-conference play, Princeton allowed opponents to make .22 FT/FGA, but since the Ivy League season started, that number has dwindled to just .13. This leads the league by a significant margin: Dartmouth is next at .15, and the league average is .20.
The only factor in which the Princeton defense does not top the league is forced turnovers. The Tigers’ opponents turn the ball over on 26 percent of their possessions, right around the league average. Columbia is well ahead of the rest of the league, at 32 percent, while Brown is a clear second at 29 percent (though Princeton remarkably turned the ball over just 12 times in its first matchup with the Lions).
Ultimately, the numbers show that Princeton has dominated the Ivy League as thoroughly as its record indicates. Should the Tigers hold on to win the title, this team, which takes care of the ball extremely well and consistently outshoots its opponents, will instill fear in any major-conference team come March.
Postscript
This was written using data as of Feb. 13 in order to ensure that unbalanced schedules would not skew any of the numbers. But another weekend of play has passed since then, so what else have we learned?
The Tigers turned in a pair of league-average offensive outings at Yale and Brown — their two worst outputs of the conference season — yet still rolled to a pair of 20-point victories. They managed this on the strength of their defense, which turned in its two best performances to date. Despite playing a pair of very fast-paced games (76 possessions with Yale, 73 against Brown), Princeton held both opponents to season lows in points. The Bulldogs scored just .58 PPP, while the Bears were even worse, at .51. This came almost entirely on the strength of tremendous field-goal defense by the Tigers: Yale posted just a 26.6 eFG, and Brown managed just 25.
On the other end, Princeton shot the ball relatively well, but it was hurt by a different factor in each game.
The Tigers grabbed just nine of 45 available offensive rebounds at Yale, their lowest mark in Ivy League play. Against Brown the next day, they were uncharacteristically plagued by turnovers, coughing up the ball 25 times (34 percent of possessions). Not coincidentally, the only other time Princeton has had trouble holding onto the ball in league play was its first meeting with the Bears (21 turnovers in 72 possessions).
Around the league, Harvard put some distance between itself and the rest of the field with victories over Columbia and Cornell, establishing itself as Princeton’s top (and, at this point, only) challenger in the Ancient Eight. The Crimson is two games behind the Tigers but a game-and-a-half up on everybody else.
The Lions’ defense was again its downfall; the league’s worst field-goal defense allowed Harvard to post a 58.3 eFG, just enough to eke out a two-point road victory.
Read More

Princeton rowing sees success in national championship regattas
Leila Eshaghpour-SilbermanAt the national championships this spring, Princeton rowing stood strong against the competition.
At the national championships this spring, Princeton rowing stood strong against the competition.

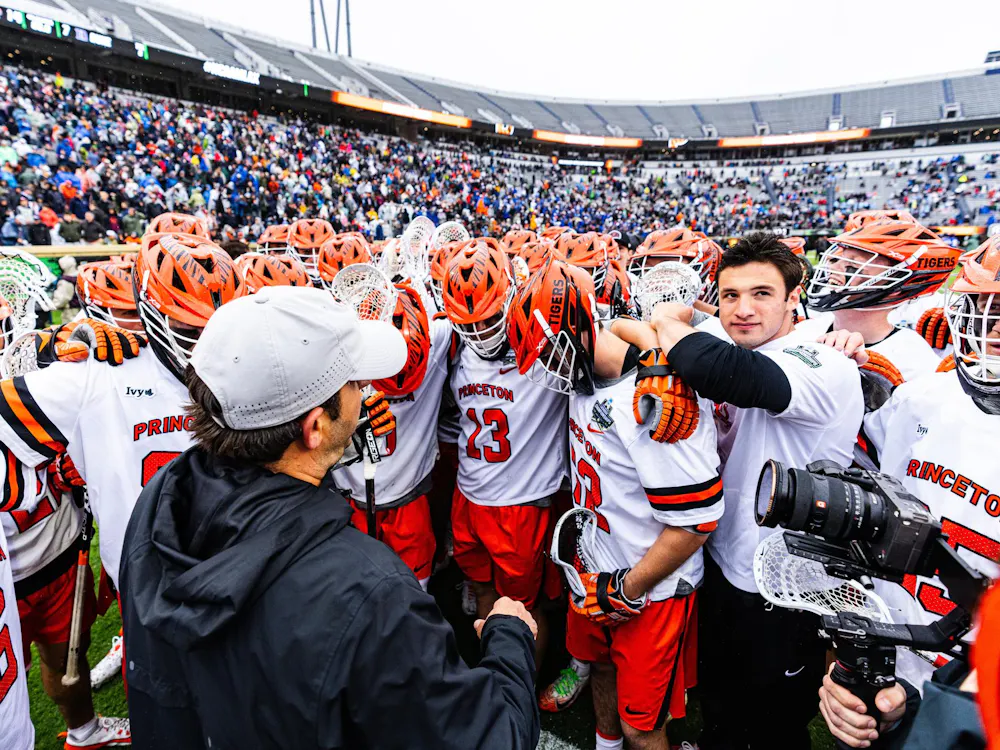
The wait is over: No. 1 men’s lacrosse roars past Notre Dame to secure first national title since 2001
Hayk Yengibaryan and Cadigan PerrielloWith the win, the Tigers captured the program’s seventh overall title and its first since 2001. After erasing an early 3–0 deficit, the Tigers scored 11 unanswered goals en route to a 16–9 win in Charlottesville, Va.
With the win, the Tigers captured the program’s seventh overall title and its first since 2001. After erasing an early 3–0 deficit, the Tigers scored 11 unanswered goals en route to a 16–9 win in Charlottesville, Va.
Croddick leads No. 1 men’s lacrosse past Duke, will play two-seed Notre Dame on championship Monday
Hayk YengibaryanThe Tigers will play the two-seeded and No. 3 ranked Notre Dame in the title game on Memorial Monday, seeking their first championship in 25 years.
The Tigers will play the two-seeded and No. 3 ranked Notre Dame in the title game on Memorial Monday, seeking their first championship in 25 years.