


In 2017, Princeton accepted 101 undergraduate students from its waitlist.
In 2018, that number dropped to zero.
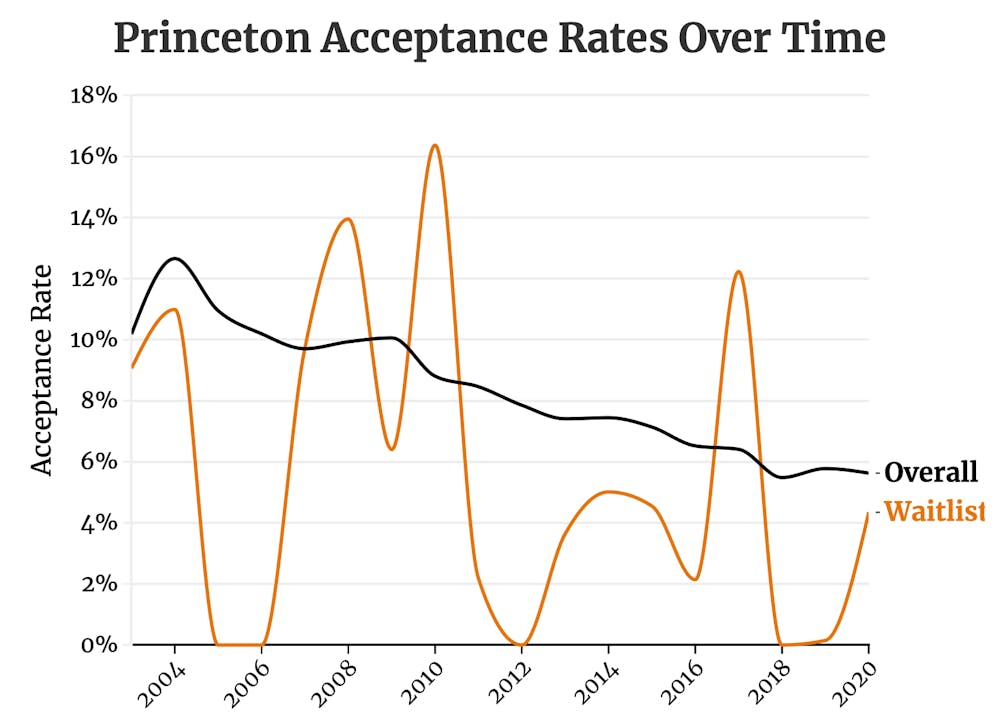
Waitlist acceptance rates — the percentage of waitlisted students to whom a school offers admission — have varied greatly at the University and many of its peer institutions in recent years. Waitlist sizes have remained largely unchanged. This phenomenon contrasts sharply with overall undergraduate acceptance rates, which have consistently trended down for decades.
Utilizing data from the Common Data Set, a collaborative data-sharing project among institutions of higher education, The Daily Princetonian analyzed trends in undergraduate waitlist admissions at a collection of the country’s most selective colleges and universities.
When available, the ‘Prince’ examined data on waitlist admissions from Princeton, Cornell University, Dartmouth College, Georgetown University, Northwestern University, Massachusetts Institute of Technology (MIT), Stanford University, and the University of Pennsylvania (Penn).
Due to inconsistencies in the Common Data Set, the ‘Prince’ collected various depths of admissions information. Data from Princeton, Cornell, Dartmouth, MIT, and Northwestern begins in 2003, data from Stanford begins in 2008, and data from Georgetown and Penn begins in 2009.

Sarah Graham ’03, the director of college counseling at Princeton Day School, a local pre-K to 12 private school, pointed to the randomness of student choice as a key factor in the variation.
“All the predictive models in the world, sometimes, can’t necessarily capture the decision-making of teenagers,” Graham said in an interview with the ‘Prince.’ She served as an admission officer at the University from 2003 to 2005. “I see that play out year after year too … sometimes it’s really random how teenagers make decisions.”
Jeffrey Durso-Finley, the co-director of college counseling at the Lawrenceville School, a local boarding high school, and a former admission officer at Brown, agreed: “You’re dealing with the natural variation of the inclination of 18-year-old kids. There’s a little bit of randomness to it.”

From 2003 to 2020, Princeton offered a spot on the waitlist to an average of 1,153 undergraduate applicants. On average, 823 applicants accepted this offer. Both of these number rarely shifted dramatically — 75 percent of Princeton waitlists that the ‘Prince’ analyzed included between 789 and 906 students.
In 2020, the most recent year for which data is available, Princeton, Cornell, Dartmouth, Georgetown, Northwestern, MIT, Penn, and Stanford received a combined total of over 270,000 undergraduate applications. While the number of applications continues to rise, the size of waitlists has not significantly changed from year to year.
According to Durso-Finley, the University’s waitlist tendencies mirror those of its peer institutions.
“I don’t find the way Princeton operates their waitlist to be substantively different from any of the other hyper-selective schools,” said Durso-Finley, who has worked at Lawrenceville for over two decades. “Their applicant pool is so strong and their matriculation rate is so high, they don’t often need to go to the waiting list because they make their class based on the modeling they use.”
In a statement to the ‘Prince,’ Deputy University Spokesperson Michael Hotchkiss emphasized Durso-Finley’s claim, highlighting the school’s robust applicant pool. “We are fortunate to have a strong applicant pool each year that includes many highly qualified and interesting students who would make great contributions to the campus,” he wrote. “And each year, there are more such students than we have seats in the class.”
During the period for which the ‘Prince’ collected data, a few institutions seem to have admitted students from their waitlist slightly more consistently than others. Georgetown, for example, always accepted at least two students from the waitlist, welcoming 50 or greater during every year except for two. MIT, by contrast, admitted zero students from their waitlist in a third of the years for which the ‘Prince’ collected data.
Brian Li ’24, explained that often the same students are waitlisted at multiple highly selective colleges. Li is a head advising fellow for Matriculate, a volunteer college-advising organization that partners high-achieving, low-income students with peer college counselors.
“Oftentimes you’ll have many colleges vying for the same candidate and ultimately the student only gets to deposit in one place,” he explained.
Durso-Finley said that this phenomenon can cause a ripple effect across the admissions ecosystem. He illustrated the concept through a hypothetical: “A school has a ton of cross-admits in the northeast with Harvard, say. And all of the sudden they get some news that Harvard’s going in for 100 kids. Tufts is freaking out … a big number of those kids might come from their class.”
“So, all of [a] sudden,” he continued. “Tufts now has to go in to reflect what they lose to Harvard. Okay, now there’s another school down the chain that’s going to as well … the waitlist numbers are not specific to the institution because how they vary is also affected from other institutions.”
Data from this year’s survey of incoming University first-years indicates that at least 39 percent of respondents were also admitted to at least one other Ivy League institution, demonstrating the heavy admissions overlap at peer institutions.
Despite their idiosyncrasies and challenges for prospective students and admissions offices alike, widely agreed that waitlists are a necessary part of the college process.
“A college needs to meet its numbers,” Graham said. “They don’t want to under-enroll and not admit enough students, but the other thing at a place that’s a residential community is you can’t over-enroll … the waitlist helps make sure that they can kind of manage that enrollment.”
Hotchkiss further confirmed this practice. “Once we know how many of the admitted students plan to enroll,” he wrote in an email to the ‘Prince,’ “we turn to the waitlist to ensure that all seats in a class are filled.”
Beyond simply filling seats, waitlists can also help schools address demographic or interest-based deficiencies in their admission pool, allowing admissions officers to balance the incoming class across demographics and interests.
“They’re using the waitlist to tweak, to fashion it a little bit more in the way in which they’re targeting,” Durso-Finley said.
He later continued, “If a hyper-selective school thinks they’re going to go in for 25 kids and they do the analysis of their class and they are over-enrolled in what they predicted the engineering population to be and you’re a kid on the waiting list who’s an engineer, they’re probably not going to go to you.”
When examining trends across highly selective institutions, one might be wise to aggregate their data, given that these schools likely draw similar applicant pools. This practice results in noticeably more consistent year-to-year waitlist admission patterns.
Variation remains, but it is less regular and less dramatic. Although aggregating data can smooth trends, this change is also likely driven by the fact that a number of the listed institutions have considerable overlap in their waitlist pools.
The University declined to comment on the specific details of its waitlist process and the data the ‘Prince’ acquired cannot fully explain the myriad factors behind waitlist admission. The Common Data Set rarely indicates how many students choose to enroll in a given school after being admitted from the waitlist, and there is no publicly accessible way to precisely assess the overlap between various waitlist pools.
Resting at the confluence of overwhelming quantity and unpredictable decision-making, waitlist acceptance rates at highly selective colleges and universities are subject to significant variation. The processes that govern waitlist acceptances are a combination of secretive and random, creating scattershot results that buck conventional admission trends.
Sam Kagan is the Head Data Editor and a senior writer with experience reporting on University finances, alumni in government, University COVID-19 policy, and more. His projects, including the Frosh Survey, focus on numerical storytelling and data journalism. He previously served as a news editor. Sam can be reached at skagan@princeton.edu or on Twitter @thesamkagan.
Read More

Princeton researchers deny allegations that 2004 climate paper was ‘significantly shaped’ by oil executives
Sena ChangA ProPublica and Drilled investigation alleged BP executives helped shape a widely cited 2004 Princeton climate paper that popularized carbon capture, a claim the authors dispute. The report has renewed criticism of Princeton’s ties to the fossil fuel industry.
A ProPublica and Drilled investigation alleged BP executives helped shape a widely cited 2004 Princeton climate paper that popularized carbon capture, a claim the authors dispute. The report has renewed criticism of Princeton’s ties to the fossil fuel industry.

New data and AI unit quietly absorbs five research units, costing survey research director his job
Nico David-FoxEdward Freeland, Princeton’s survey research director, lost his job when the University folded his center into a broader push to consolidate its data and AI efforts. Some faculty say the reorganization was handled with little transparency or consultation.
Edward Freeland, Princeton’s survey research director, lost his job when the University folded his center into a broader push to consolidate its data and AI efforts. Some faculty say the reorganization was handled with little transparency or consultation.
Undergraduate cyclist struck by University employee sues for damages
Haeon LeeThe student, who was seriously injured, is suing the University, the employee, and the owner of the vehicle for damages.
The student, who was seriously injured, is suing the University, the employee, and the owner of the vehicle for damages.