eData reveals rich places are overrepresented in student body
A jogger yelled “Go Tigers” to me when he noticed my Princeton baseball cap. He was one of a strangely large number of people who were passionate about Old Nassau during a Saturday excursion that I took this past summer. I looked out at a vista of the Long Island Sound. Some of the largest houses that I had ever laid my eyes upon lined the shores. Sailboats drifted in the wind as Land Rovers drove by behind me.
Welcome to Greenwich, Connecticut, where money basically grows on trees. Very few Americans can afford to live in this town of 60,000 people with the median home sales price well above $1.2 million, but dozens of places like it are sprinkled throughout the country. Elite colleges are attracting students from these kinds of towns — a lot of them actually.
New data that I analyzed reveals that a sizable fraction of Princeton’s undergraduates come from these areas of concentrated wealth. I mapped a list of hometowns for the Classes of 2020-2023 that I obtained from the Residential College Facebook before administrators disabled this feature on September 6th. The results show significant regional divides in the student body.
Geography
One in ten Princetonians hail from a hometown on Bloomberg’s 2018 list of “100 richest places,” where just half a percent of all Americans live. Families on average earn $198,000 in the lowest ranked town and $443,000 in the highest. Students from Bloomberg 100 towns almost equal those from the entire U.S. Census-designated Midwest.
I ordered hometowns based on the number of students from them.
First place goes to Manhattan, New York for sending 141 students. Princeton, New Jersey came in second for bringing 130 students, accounting for 16 percent of the University’s New Jerseyans. Greenwich, Connecticut is fifth at 46 students when constituent villages and boroughs are grouped as part of the same city.
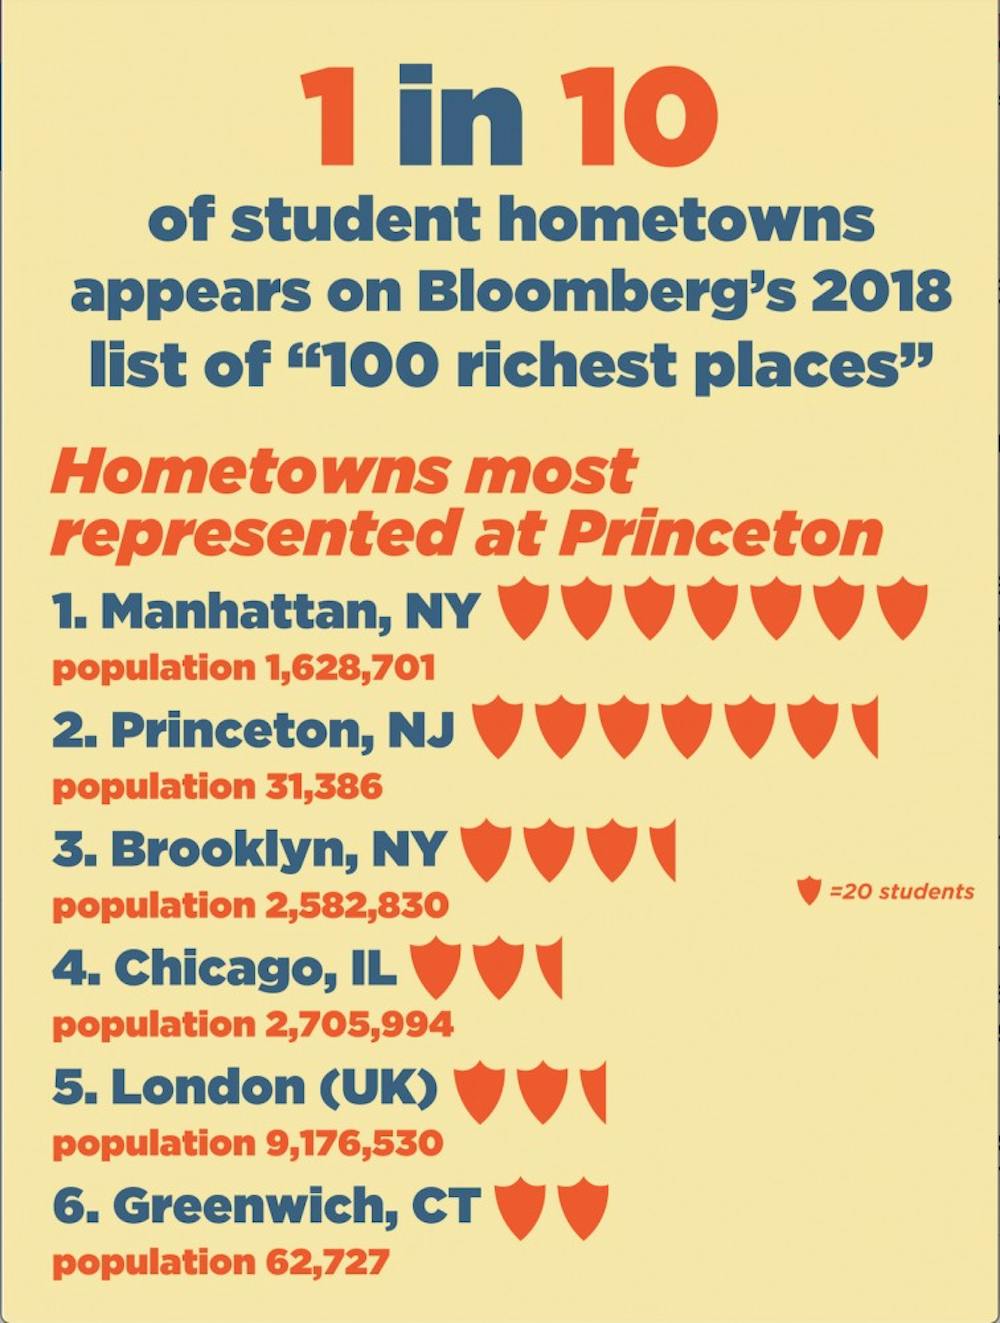
Graphic Credit: Charlotte Adamo / The Daily Princetonian
Nearly two-thirds of hometowns sent only one person to Princeton, yet students from the top 290 hometowns outnumber the next 1,963 combined. Statistics like these normally aren’t surprising because major metropolises would be expected to dominate the rankings.
But that didn’t exactly happen. Settled on the list between America’s largest cities — Atlanta, Georgia, Saint Louis, Missouri, Austin, Texas, among others — are dozens of small wealthy towns such as Chevy Chase, Maryland (median household income: $173,333), Palo Alto, California ($147,537), and Montclair, New Jersey ($113,293). The number of Bethesda, Maryland ($154,559, population: 60,858) students eclipses that of Boston, Massachusetts and Phoenix, Arizona together (population: 2.3 million).
Two thirds of Princeton’s 118 Connecticuters live in towns on the Gold Coast — the lower half of Fairfield County known for being home to New York City’s successful businessmen — despite it hosting just 10 percent of the state’s entire population. The Guardian said that this place had “the densest concentration of wealth in the country.”

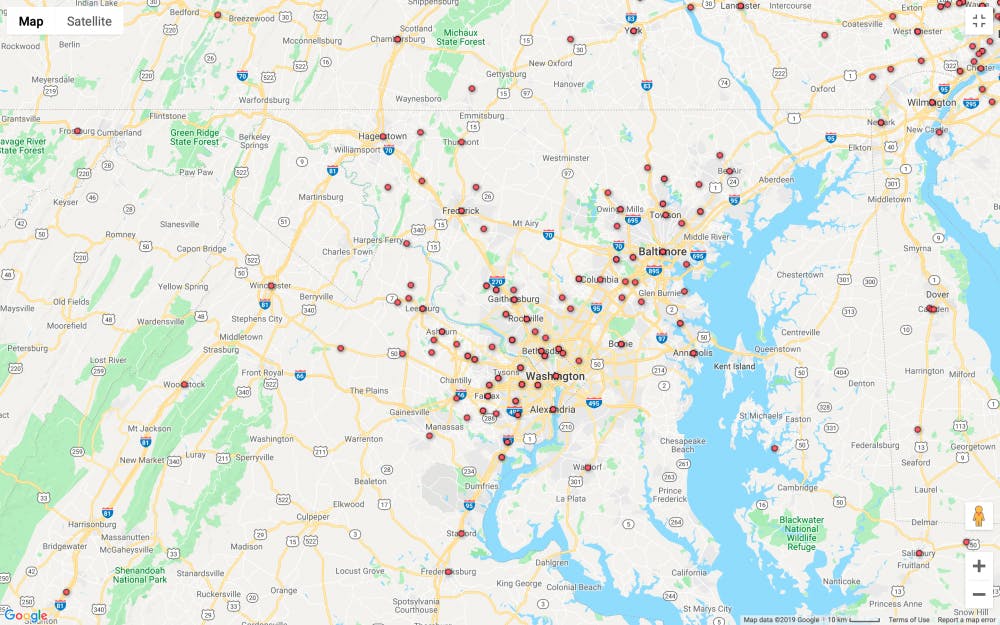
The prosperous region colloquially known as “Northern Virginia” is doubly overrepresented among Princeton’s student body relative to its actual share of Virginia’s population. Across the Potomac River, half of undergraduate Marylanders live in Montgomery and Prince George’s Counties, which is 56 percent out of its true proportion.
Chicago’s affluent North Shore may be home to only 3 percent of Illinoisans, but it sent a quarter of those who attend Princeton. This region featured prominently in journalist Daniel Golden’s book “The Price of Admission” for some of its influential families who got their children into elite universities by giving hefty donations.
One in three Massachusetts Princetonians live in their state’s fifteen richest towns that otherwise are home to less than one in twenty of their fellow Bay Staters. Residents of Philadelphia’s Main Line outnumber Kansans, Oklahomans, and South Dakotans combined.
West Coast geography is equally lopsided. If the ten wealthiest places in California’s Orange, Los Angeles, and Santa Clara Counties — covering Los Angeles and Silicon Valley money — were counted as a single state, they would rank seventeenth in their contributions to Princeton, just three people behind Washington.
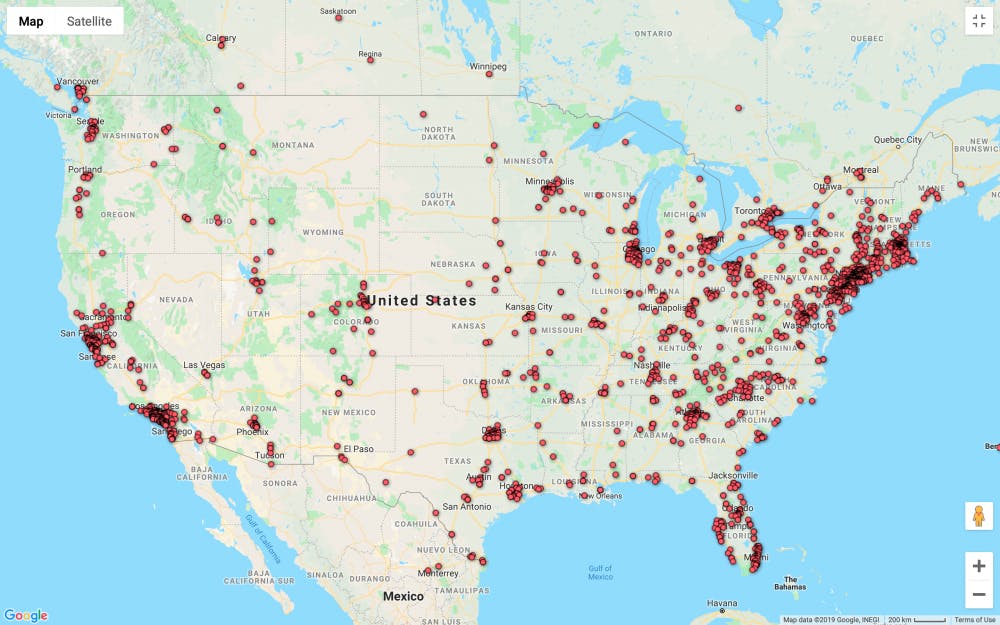
I next identified hometowns’ counties for 87 percent of students and matched them to metropolitan statistical areas (MSA) with U.S. Census data. At least a quarter reside in the New York-Newark MSA, and slightly more than a third are from MSAs along the Interstate-95 corridor from Boston to Washington, D.C.
I used hometowns’ latitude and longitude coordinates to calculate Princeton’s median center of population. It’s located 9 miles west of Carlisle, Pennsylvania. In practical terms, this point means that more than half of undergraduates live east of the Appalachian Mountains. In compariosn, the U.S median center of population is 550 miles away, in southwestern Indiana.
High Schools
I acquired a list of every high school represented in the Classes of 2019-2021 from PolarisList, an online web service that ranks high schools by the number of students who attended Princeton, Harvard, and the Massachusetts Institute of Technology (MIT). The website says that its data comes from “a variety of online and offline sources” through “rigorous exploration,” and it’s 88 percent complete.
The Lawrenceville School is Princeton’s biggest feeder school, sending 47 students in 2015-2017 (as well as 8 to Harvard and MIT each). Its annual boarding fees are $66,360. Princeton High School comes in second at 46; Thomas Jefferson High School, third, at 33.
Lawrenceville School Director of Public Relations Lisa Hanson neither confirmed nor denied PolarisList’s statistics but stated that 31 of the school’s alumni are currently in the Classes of 2021-2023.
Princeton High School’s college counselor didn’t respond to my request for comment.
One in twenty students came from just 5 high schools: Bergen County Academies, Phillips Exeter Academy, and the three previously mentioned. The latter’s yearly boarding fees amount to $55,402. Graduates from the top 13 high schools could fill McCosh 50.
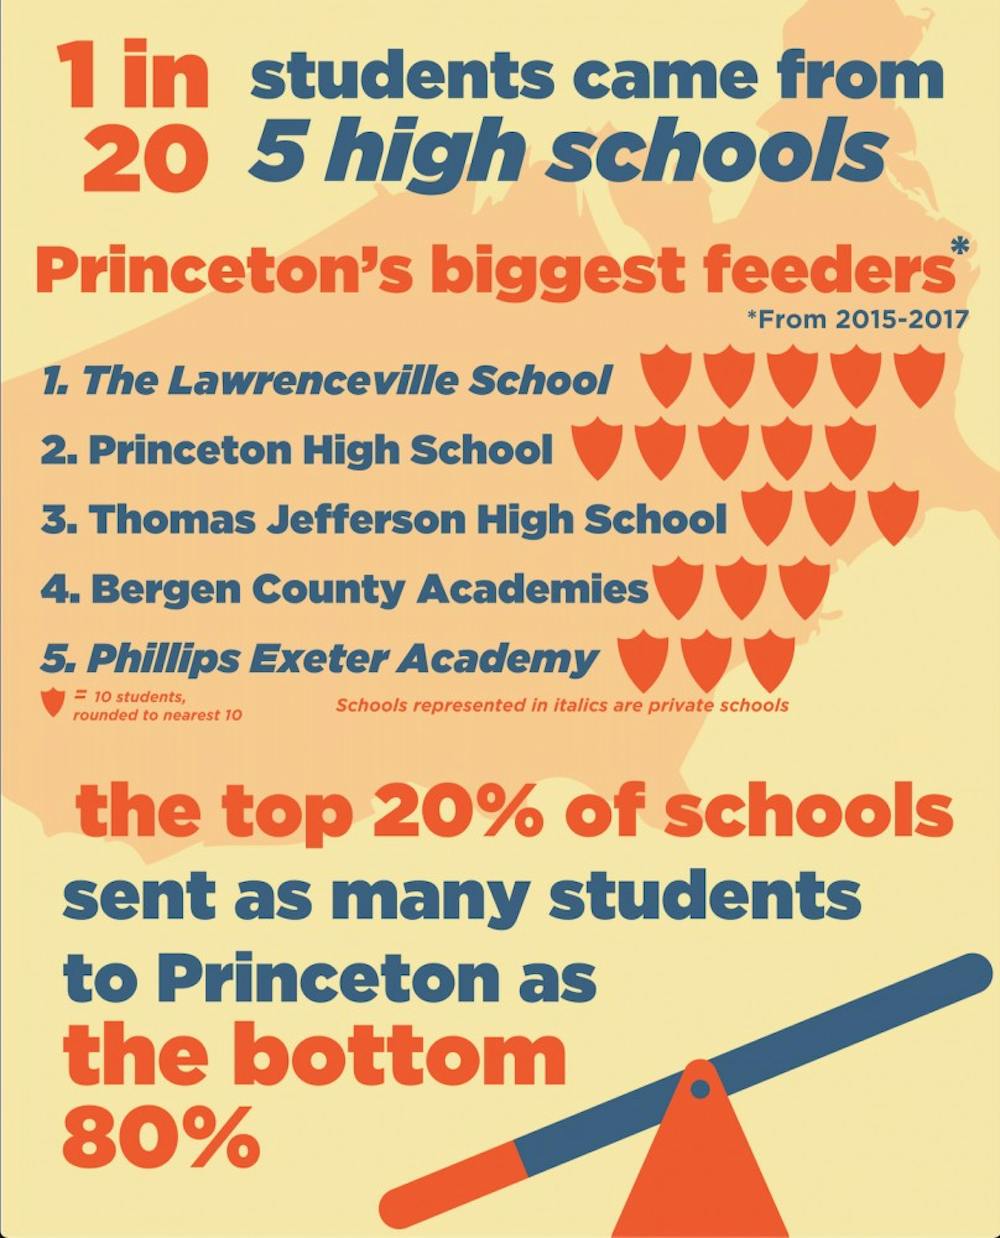
Graphic Credit: Charlotte Adamo / The Daily Princetonian
Half of the leading 100 high schools — of over 2,200 total — are private, and their median cost is $49,496 per year. Only 5 percent of public schools sent four or more students in three years, versus 12 percent of private schools.
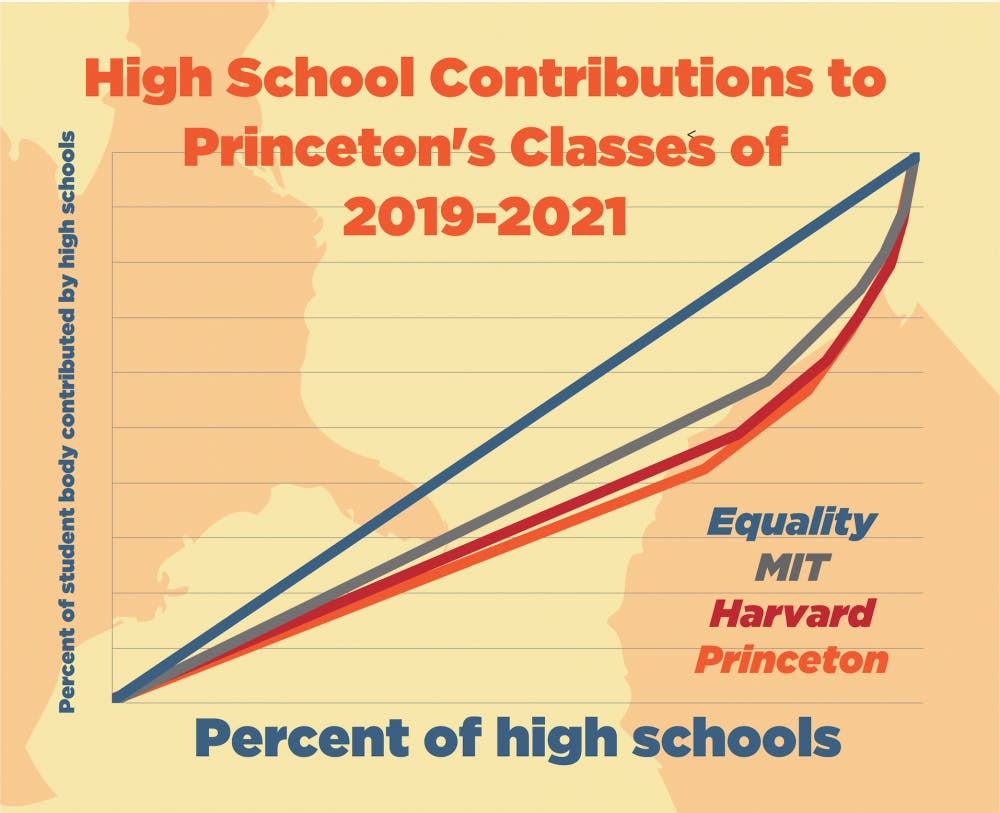
I created Lorenz curves for each college and calculated their Gini Coefficients (GC). Under this metric, 0 represents all high schools sending the same number of students and 1 is one high school sending all students. My curve for Harvard closely mirrored what The Harvard Crimson found in 2013 from its own investigation.
The top 20 percent of high schools sent as many students to Princeton as the bottom 80 percent. Old Nassau’s GC is 0.37, while those of Harvard and MIT are 0.33 and 0.25, respectively. Simply put, Princeton takes in more first-years from fewer high schools than its rivals.
Michael Rutter, MIT’s Senior Advisor for Communications, didn’t answer the questions in my e-mail but forwarded a link to a memorandum issued after the recent college admissions scandal.
“At MIT we are deeply committed to the principles that guide our merit-based admissions process,” the memo stated. According to it, athletes “do not get ‘slots’” and they — along with legacies, donors, or “other categories of applicants” — must undergo the same admissions process as everyone else.
Graphic Credit: Charlotte Adamo / The Daily Princetonian
MIT’s lack of preferences may be steering it clear of the Ivy League’s geographic concentration. Princeton’s 2016 profile, for example, reveals that “alumni children” composed 2 percent of applicants but 14 percent of the Class of 2020. The Harvard Crimson reported for the Class of 2021 that 58 percent of legacy students’ families lived in suburbs.
Harvard’s Office of Communications didn’t respond to multiple requests for comment.
Princeton’s Undergraduate Admissions Office deferred to the Office of Communications.
“All admitted students are here because of their demonstrated merit and ability to thrive under the demands of a Princeton education,” Deputy University Spokesperson Michael Hotchkiss wrote in an e-mail. He reiterated that a quarter of undergraduates are Pell grant-eligible, 16 percent are the first person in their family to attend college, and that Princeton forges partnerships with nonprofits to encourage low to middle-income seniors to apply.

Map of eating club median centers of population
Eating Clubs
Geographic divides impact students’ social lives on Prospect Avenue. I next mapped the eating clubs’ median centers of population using the membership rosters that I downloaded last fall. The University’s meal exchange website was altered this past spring, making it impossible to acquire current rosters.
Cottage was indeed the most southern — and western — eating club, with its center around Morgantown, West Virginia. No other club came close. The next nearest ones — Cannon, Colonial, and Quadrangle — were a hundred miles away, near Bedford, Pennsylvania.
Ivy had the membership from the farthest east. Its center of population was four miles west of Princeton, New Jersey. Just a quarter of its members came from beyond the Appalachian Mountains, many of whom lived in California’s wealthiest towns.
Cap, Charter, and Terrace were not far behind Ivy, with centers in eastern Pennsylvania. Cloister’s membership was the most northern.
About one in five of Cottage’s members have hometowns on the Bloomberg 100 list, the most of any club on “The Street.” Ivy and TI were second (16 percent) and third (15 percent), respectively. These were the only eating clubs where Bloomberg 100 students were overrepresented compared with the student body overall.
Charter, Colonial, and Terrace ranked at the bottom, with 6 percent each. Bicker clubs had just double the total membership as Sign-in clubs but three times as many Bloomberg 100 students on their rosters.
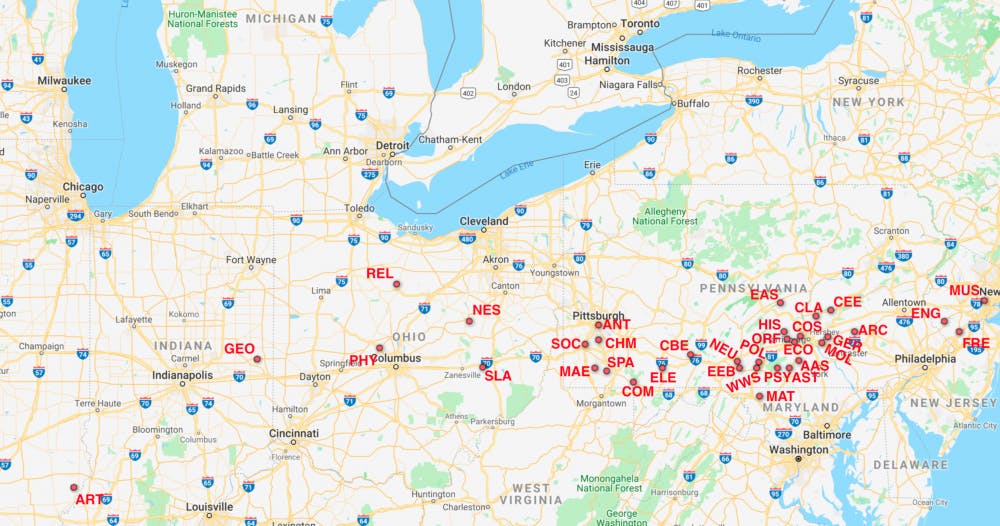
Map of departmental centers of population
Departments
Departments also showed regional influences. Upperclass-students hailing from towns on the Bloomberg 100 list are 20 percent less likely to study science, technology, engineering, and mathematics (STEM) than upperclass-students overall. Yet, international students are 31 percent more likely to concentrate in STEM.
I calculated departments’ median centers of population.
Art and Archaeology students’ geographic backgrounds most closely matches that of the U.S. population. Their center is in southeastern Illinois. Geosciences was not much farther away, in eastern Indiana. Only four other departmental centers of population broke out of east coast states: Physics, Religion, Slavic Languages, and Near Eastern Studies.
Music students are the most eastern ,with a center just outside Newark, New Jersey. French and Italian is second, in northern Princeton, and English, third, in Flemington.
Classicists cling to coastal cities, mainly New York and Washington, D.C. Just 4 of 18 live west of the Appalachians. French, Italian, and German students mostly come from the I-95 corridor cities. English has a mere 5 students of 73 from between the Mississippi River and Sierra Nevada Mountains.
Analysis
New York Times columnist Ross Douthat made an uncanny prediction a decade ago about Ivy League students. He argued that admissions offices discriminated against the white working class, and that a college could boost its geographic diversity by admitting students from “upscale Bobo enclaves even in states that we think of as rural and ‘red.’”
Critics at the time chastised him for overinterpreting data that Professor Thomas Espenshade published in his book “No Longer Separate, Not Yet Equal.” But it looks like my geographic investigation backs up Douthat to a degree. Pick any red state with a sizable contingent on PolarisList, and private schools or public schools in well-to-do neighborhoods are certain to top its rankings.
Princeton isn’t picking up an assortment of professionals’ children in cities and small towns from sea to shining sea. It’s disproportionately pulling in students from the richest — mostly eastern — places in the country. Many small moneyed suburbs send more students to Princeton than entire regions with millions of people.
Elite colleges probably aren’t outright discriminating against the white working class, as Douthat claims. Rather, they’re not letting go of their traditional blue-blooded base, cutting down the number of seats that could be available to everyone else. A paper published last month found that 43 percent of Harvard’s white students in 2009-2014 were athletes, legacies, on the “dean’s list,” or faculty children.
Princeton’s words seem to say that Cambridge’s crude practices don’t happen down in civilized New Jersey. It has a motto about being in the nation’s service and touts its minority students. Every year, it sends promotional materials to thousands of high school seniors, encouraging them to spend $65 on an application. “We look for students with intellectual curiosity, who have pursued and achieved academic excellence,” the admissions website states.
Former columnist Lou Chen ’19 discovered that the Ivy League made more visits to the $39,700 per year private Harvard-Westlake School in twelve months than all of San Bernardino’s public high schools in recent memory.
When journalists confront administrators about these contradictions, these administrators either deny them or assert that applicants get a “fair shake.” Few places in America outside of Capitol Hill have as much hypocritical moral grandstanding as an Ivy League university.
But Princeton can fix its geographic skew through a two-pronged approach. It first needs to end its admissions practices that benefit wealthy students like athletic and legacy admits. MIT’s moral compass points true north and doesn’t deviate for donors. Old Nassau ought to follow its lead.
Then, the University should continue to expand its outreach to improve awareness. Eastern Colorado provides a creative solution to this second strategy.
William John, Class of 1910, created the Mary John Goree Scholarship at Princeton University under the condition that it would cover all tuition and fees relating to undergraduate or postgraduate degrees for residents of Las Animas County, Colorado. It has supported 30 students since 1962.
“The east coast is very much a culture shock,” said Sally Jane Ruybalid ’21, the scholarship’s latest recipient. She is from Trinidad — a town of 8,000 people near the New Mexican border — and graduated from a high school that didn’t have a library or safe science laboratory.
The stereotypes that her eastern classmates have of westerners sometimes make her laugh. They’ve asked if she lives on a ranch and rides horses — both of which aren’t true. Others are more pernicious, such as the assumption that she’s a first-generation student. Both of her parents have professional degrees.
“Even if someone is from a rural town, it doesn’t mean that we don’t have culture, and it doesn’t mean that we don’t have education,” she said.
The magic of the scholarship is that it encourages high school seniors to apply and keeps alumni involved in this overlooked region.
“I think that there’s probably more awareness of Princeton in Las Animas County today than there has been since I first started visiting the County during the 1980s,” scholarship director David Vandermeulen ’81 wrote in an e-mail.
He holds annual promotional presentations and estimated that 70 to 80 students were in attendance at his most recent one. Admissions officers have also held separate public meetings in the county for four of the past five years.
Princeton should have more scholarships like the Mary John Goree fund. Admissions is and always will be a game of tradeoffs. Morrison Hall frequently has to choose between taking someone from an obscure public school or another student from a renowned eastern boarding school. Picking the first is a risky move because it’s uncertain whether he or she has the necessary preparation to thrive in an intense academic environment.
But stories like the Mary John Goree Scholarship prove that success is possible. It pushes the ball towards creating, in Ross Douthat’s words, “an elite that’s broadly representative of the country as a whole.” Princeton should take the risk on that public school student more often.
METHODS
I obtained students’ hometowns from the Residential College Facebook, whose total number of undergraduates closely matches the University’s most recent statistics. Max Rice’s Excel Geocoding Tool located their corresponding longitudes and latitudes. I plotted hometowns in Google Fusion Tables.
The Residential College Facebook explicitly named every New York City borough except Manhattan. It had an ambiguous listing of “New York, NY” for 141 students. I looked up a number of classmates who I knew reside in Manhattan, and their hometowns were listed as “New York, NY.” For this column, I assumed that “New York, NY” meant Manhattan, but I can’t rule out the possibility that students from other boroughs are included under this label.
Median household incomes came from the latest U.S. Census estimates or Data USA. All private school costs were reported on their respective websites and do not refer to day school costs unless a boarding option was not available. Annual non-enrollment fees were included if listed.
Statistics refer solely to the American fraction of its student body.
PolarisList didn’t mention foreign secondary schools, and I couldn’t find diversity statistics from Harvard and MIT to remove them from their student totals. So I counted all internationals as coming from single student secondary schools when constructing my Lorenz curves.
This isn’t true in real life. I checked the college matriculation statistics of several famous feeder schools abroad — Eton College, Singaporean American School, American School of Hong Kong, etc. — but none of them came close to sending as many students as U.S.-based feeder schools. International students are fewer and generally more spread out than American students, so it’s unlikely that my GC estimates would significantly change with official data.
The Gold Coast, Philadelphia Main Line, Northern Virginia, and North Shore are informal cultural regions. They don’t have official U.S. Census-designated boundaries. I relied upon Wikipedia to define them as a “wisdom of the crowd” approach.
This is the first article in a series investigating the geography of Princeton’s student body.
Liam O’Connor is a senior geosciences major from Wyoming, Del. He can be reached at lpo@princeton.edu.
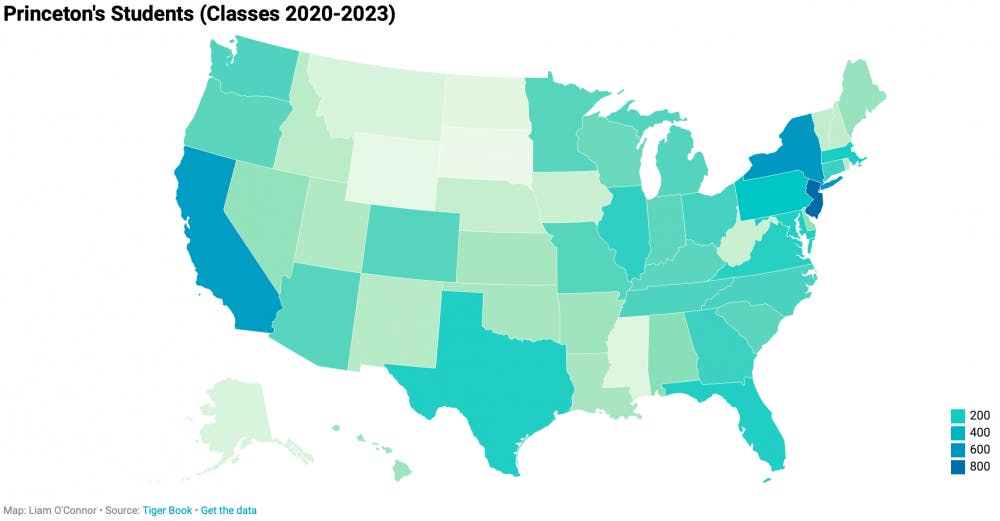
Breakdown of undergraduates by state

World map of Princeton undergraduates' hometowns
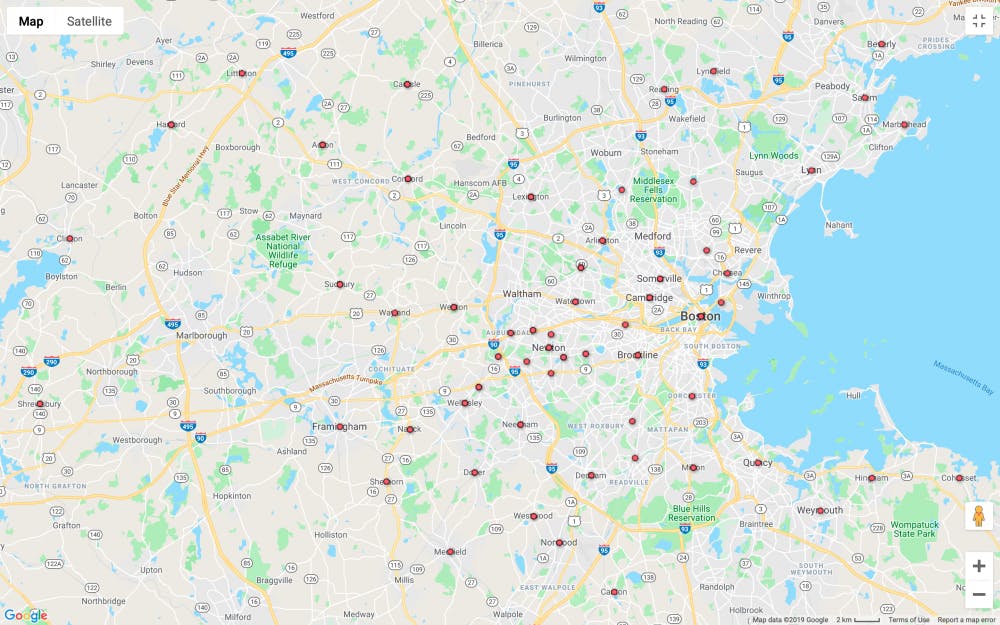
Boston area hometowns
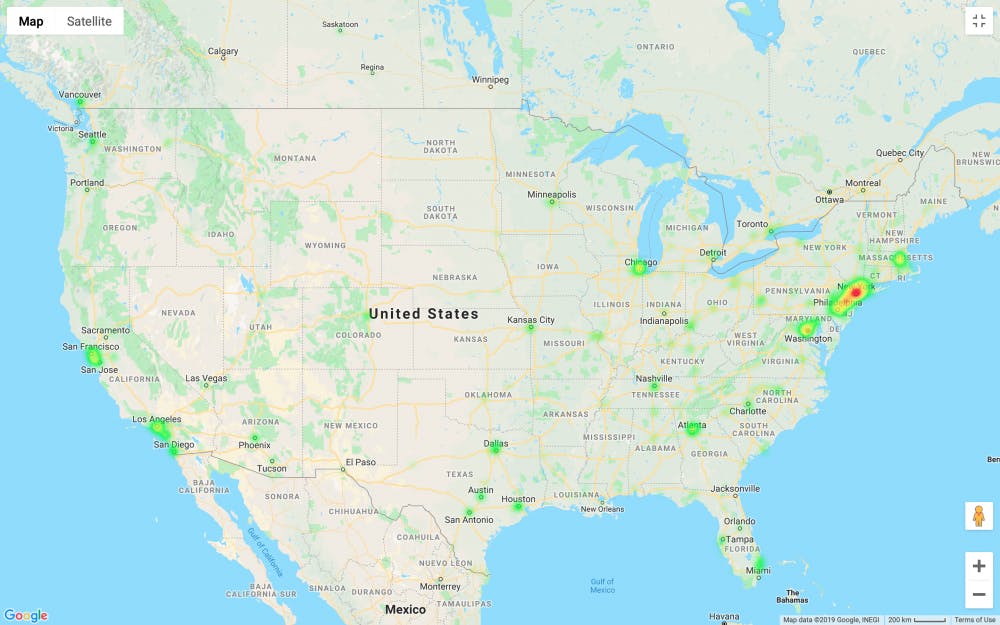
Concentration of Princeton undergraduates

New York City metropolitan area hometowns
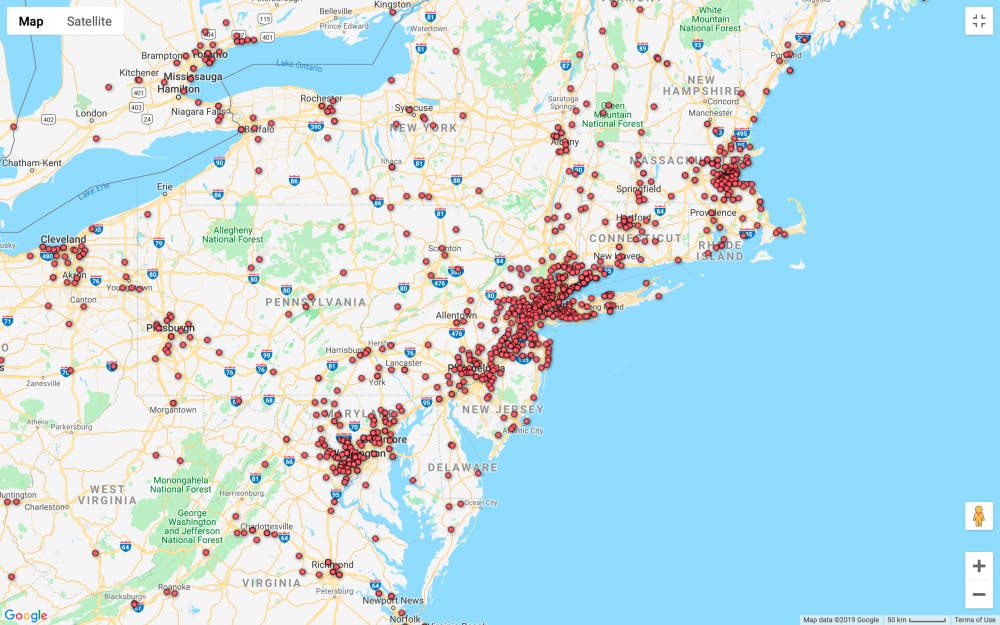
I-95 Corridor hometowns