


Today, though, members of the media and people in baseball are considered backward if they don’t base their analyses on OPS or more advanced statistics. Batting average and RBI have lost some of the luster they once had. The reasons for this are easy to see in retrospect if a player is on a bad team in which no one gets on base ahead of him, he will never have an opportunity for RBIs. It’s not the batter’s fault that he couldn’t bat in runners, because there were no runners there for him to bat in. Batting average is clearly not as important as on-base percentage because walks and hits both avoid outs, which are the main problem in baseball.
Even casual fans now recognize complicated defensive statistics such as the Ultimate Zone Rating. Advanced statistics have also become commonplace in baseball front offices, famously thanks to Billy Beane’s “Moneyball.” (Though after the Oakland Athletics’ past few years of mediocrity and worse, maybe some teams are reconsidering Beane’s path.) Most, if not all, teams use statistics such as OPS and UZR when analyzing minor league prospects.
Baseball has embraced the statistical revolution. In retrospect, you wonder why it did not happen sooner, as RBIs especially is a poor statistic. But will this statistical revolution expand to the other major American sports, namely football, basketball and hockey?
Many would argue that these sports will undergo similar statistical revolutions in the near future, just as baseball has done in the past 20 years. The dramatic expansion at the Massachusetts Institute of Technology Sloan Sports Analytics Conference — what ESPN columnist Bill Simmons lovingly calls “Dorkapalooza” — attests to this supposed wisdom. But I am not so certain that this will be the case. Football, basketball and hockey have many more variables than baseball, and they are correspondingly much harder to analyze successfully.
Baseball is a static game by nature, much more so than basketball and hockey, especially. Disregarding inning and count — which is a bit of a stretch, I will concede — there are only 24 possible states a baseball game can be in. (A state is any different situation on the bases. For example, one state would be no runners on base with no outs, while another would be bases loaded with two outs.) Even including the pitching count in the number of states, the number is still relatively low, at 288 possibilities.
Let’s compare this with the other sports. First, in football, the possible number of states would be vastly larger even than 288, as teams could be anywhere on the field in various formations. In basketball and hockey, the number of possible states could not even really be quantified. What is a state in a game where the players can move at will? I guess that in basketball, the number of fouls that each player on the court has, combined with the score of the game, could possibly create a state, but that discounts the player’s position on the court, which is much more important than either of those two quantities.
The small, finite amount of possible states in a baseball game allows the complex statistics to be computed easily. This is not the case in the other three sports, making such statistics more challenging to calculate.
In addition to being a static game, when it comes down to it, baseball is an individual game between the pitcher and the hitter. What happens on the basepaths or in the outfield does not affect the batter, discounting all mental aspects of the game. This is completely untrue in the other three sports.

For example, in football, when the quarterback drops back to pass, many players are involved. Even before the ball is thrown, the offensive line attempts to block the defensive line from sacking the quarterback, meaning that eight to 10 players in addition to the quarterback are already impacting the play.
After the ball is thrown, the receiver attempts to catch the ball while the defensive backs and the safeties attempt to defend the pass, adding an additional two to four players to the play.
Finally, if the ball is caught by the receiver or intercepted by the defense, the other players attempt to tackle the ball carrier.
For simplicity’s sake, let’s say that this adds another three players to the play. This means that 14 to 18 players are involved directly in the play, not to mention the additional players who would presumably attempt to tackle the receiver.
How can you possibly quantify these possibilities in a statistic?
The question of a pass completion cannot be boiled down to a battle between a single defender and the quarterback-receiver pair.

Similarly, in hockey and basketball, players are always moving around, so there is almost never an individual moment in either game.
The individualized nature of baseball is the key reason that player-specific statistics such as OPS and even the much-maligned batting average can be calculated. Because this does not exist in the other three sports, a statistical revolution seems much less likely.
Of course, the next Bill James could come along and prove me wrong in 20 years, so I won’t say that a statistical revolution in football, basketball or hockey is impossible — only highly improbable.
Read More

Princeton rowing sees success in national championship regattas
Leila Eshaghpour-SilbermanAt the national championships this spring, Princeton rowing stood strong against the competition.
At the national championships this spring, Princeton rowing stood strong against the competition.

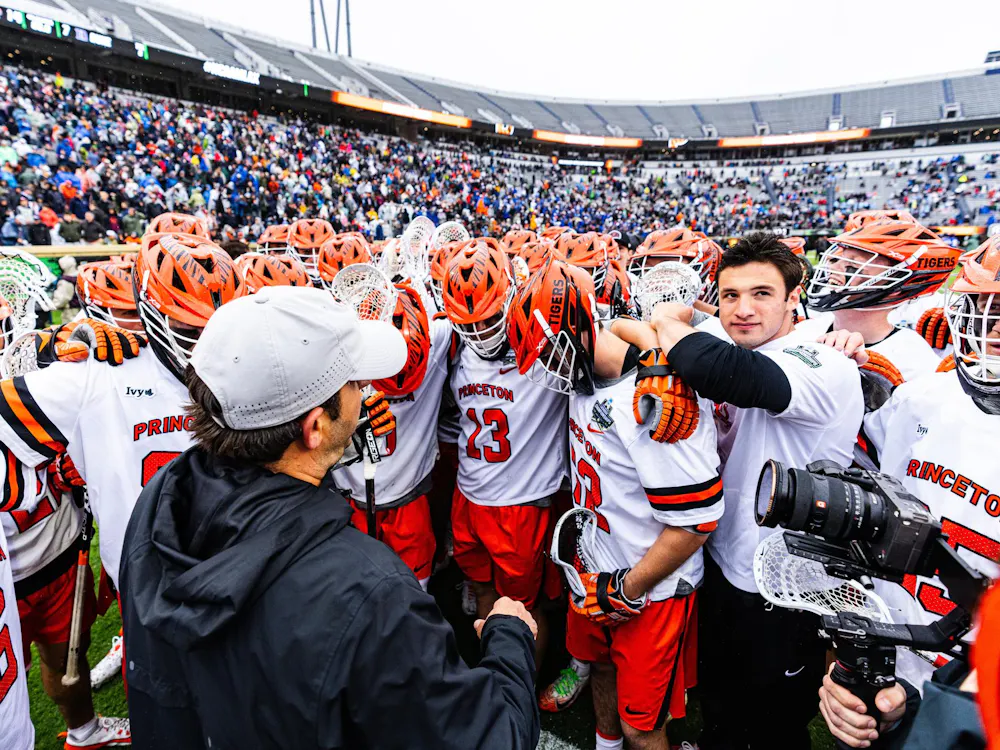
The wait is over: No. 1 men’s lacrosse roars past Notre Dame to secure first national title since 2001
Hayk Yengibaryan and Cadigan PerrielloWith the win, the Tigers captured the program’s seventh overall title and its first since 2001. After erasing an early 3–0 deficit, the Tigers scored 11 unanswered goals en route to a 16–9 win in Charlottesville, Va.
With the win, the Tigers captured the program’s seventh overall title and its first since 2001. After erasing an early 3–0 deficit, the Tigers scored 11 unanswered goals en route to a 16–9 win in Charlottesville, Va.
Croddick leads No. 1 men’s lacrosse past Duke, will play two-seed Notre Dame on championship Monday
Hayk YengibaryanThe Tigers will play the two-seeded and No. 3 ranked Notre Dame in the title game on Memorial Monday, seeking their first championship in 25 years.
The Tigers will play the two-seeded and No. 3 ranked Notre Dame in the title game on Memorial Monday, seeking their first championship in 25 years.