


In 2002, the Red Sox management, including Larry Lucchino ’67, the team’s president and CEO, hired sabermetrician Bill James as a senior baseball operations advisor. Sabermetrics, a term James coined from the acronym SABR (Society for American Baseball Research), is the quantitative analysis of baseball, and for James it has been a life-long obsession.
Two years after they hired James, the Red Sox won their first World Series in 86 years. Three years later they won again. Their secret weapons? David Ortiz, of course, and the legendary pre-game shots of Jack Daniels, as well as rookies Dustin Pedroia and Jacoby Ellsbury, Irish step dance and a healthy dose of James’ sabermetrics.
James’ analysis of the Red Sox goes well beyond standard batting averages and ERAs. He uses his own formulas to compute statistics like a team’s Pythagorean winning percentage, which approximates what a team’s winning percentage should be based on how many runs it scores and how many it allows. This percentage, calculated by squaring the number of runs scored by a team and then dividing that by the square of runs allowed plus the square of runs scored, turns out to quite accurately predict a team’s win-loss statistics.
Baseball teams, unlike, say, football or ice hockey teams, play 162 games in a season, so mathematicians can gather enough data to calculate truly meaningful statistics about the sport. Of course, the numbers get more meaningful as the season goes on and more games are played, so I, for one, firmly discount David Ortiz’s .113 batting average as a statistical artifact (i.e., there are insufficient data).
Baseball statistics long predate James’ complicated sabermetric approach, and the idea that they play a crucial role in the decisions made by a team’s management goes back to one of baseball’s most forward-thinking figures, Branch Rickey.
Rickey is best remembered for desegregating Major League Baseball when he signed Jackie Robinson to play for the Brooklyn Dodgers in 1947. But this man, who has gone down in baseball history for his openness to new ideas, for his ability to look at the game and see it as all it could be, included math and statistics in his baseball vision. The same year that he signed Major League Baseball’s first African-American player, Rickey hired mathematician Allan Roth as the team’s statistician. Roth and Rickey together would later create the on-base percentage (OBP) statistic that is still widely used today.
The history of mathematics in baseball is littered with Princetonians. Long before Lucchino began advocating a more quantitative approach to the game, Earnshaw Cook ’21 published the book “Percentage Baseball” in 1964. One of the first books written about the statistical analysis of baseball, it includes an accurate explanation for why sacrifice bunts are inefficient. Cook also got a lot wrong, however, and James would later call Cook’s analytical methods useless, saying that “Cook knew everything about statistics and nothing at all about baseball.”
Former economics professor and current Federal Reserve Chairman Ben Bernanke has also added his voice to the sabermetric debate, advocating a fairer ERA formula. The current calculation rewards pitchers who leave runners on base but are followed by strong bullpen pitching, and penalizes the ones whose closers let the runners score. Bernanke would like to see baseball adopt a formula in which one player’s ERA does not depend so heavily on another’s pitching.

While sabermetricians like James use statistics to understand and explain baseball, professors and teachers across the country have increasingly been using the subjects for the opposite purpose: using baseball to explain mathematics. Parents may wonder why their third-grade sons can’t do their math homework but can understand every baseball statistic there is — my own younger brother once explained the difference between a player’s OBP and his batting average to my mother. Now, some educators are suggesting it’s because there’s not enough baseball in the homework.
Jim Albert, a math and statistics professor at Bowling Green State University has written a book titled “Teaching Statistics Using Baseball” in which he outlines his curriculum for a first-year course in statistics based entirely on baseball. Schools like the University of Georgia, the University of Oregon and Tufts have also offered courses on baseball statistics.
Last July, MIT hosted a four-week camp for middle-school students to learn math and physics through baseball. The 24 boys who participated spent their mornings learning about sports and statistics and conducting baseball-related experiments in parabolic motion. Later in the day, the boys left the classroom for the MIT baseball diamond, where they played baseball all afternoon.
The rationale for pairing math class with baseball is as sensible as it is simple: Hundreds of thousands of Americans love and understand baseball, but many fewer love and understand math.
“Many students are familiar with sports either as a participant or a spectator,” Albert wrote in the preface of “Teaching Statistics Using Baseball.” “For many students sports is a familiar context in which an instructor can describe statistical thinking.”
Harvard biologist Stephen Jay Gould, in his 2003 anthology of essays “Triumph and Tragedy in Mudville: A Lifelong Passion for Baseball,” explores the question of why Major League batters never hit .400 anymore, concluding that it’s the result of declining variation and overall improved playing in the sport.

“No one has invested more time and energy in the study of numbers than baseball aficionados,” Gould wrote. “We have measures and indices for everything imaginable.” And the ones we don’t have, James is busy inventing, like a player’s secondary average — meant to complement his batting average — which equals (doubles + (triples x 2) + (home runs x 3) + walks + stolen bases) / (total number of at bats).
In another essay, Gould analyzes Joe DiMaggio’s 1941 56-game hitting streak, showing that it’s one of the most statistically unlikely achievements in all baseball.
Gould wrote that “DiMaggio’s remarkable achievement — its uniqueness, in the unvarnished literal sense of that word — lies in whatever he did to extend his success well beyond the reasonable expectations of random models that have governed every other streak or slump in the history of baseball.”
Gould understood that great baseball is all about defying statistical expectations. He ends his essay “Why No One Hits .400 Any More” by saying he had a hunch Wade Boggs was going to bat .400 that year. Boggs didn’t, of course, but I’m pretty sure that Ortiz will this season.
The word sabermetrics sounds like it belongs in a “Star Wars” movie rather than a math textbook, but that’s fitting, perhaps, for a game about fantasy, force and the crushing defeat of the ultimate evil empire (the Yankees).
In 2004, sabermetrics helped the Red Sox end a legendary 86-year curse, when they were the first team ever to recover from a three-game deficit to win the American League Championship Series against their Darth Vader. Like DiMaggio’s 56-game hit streak, it was a tremendous, statistically improbable, though not impossible, achievement, especially for a team assembled under the careful mathematical analysis of a full-time sabermetrician.
Read More

Princeton rowing sees success in national championship regattas
Leila Eshaghpour-SilbermanAt the national championships this spring, Princeton rowing stood strong against the competition.
At the national championships this spring, Princeton rowing stood strong against the competition.

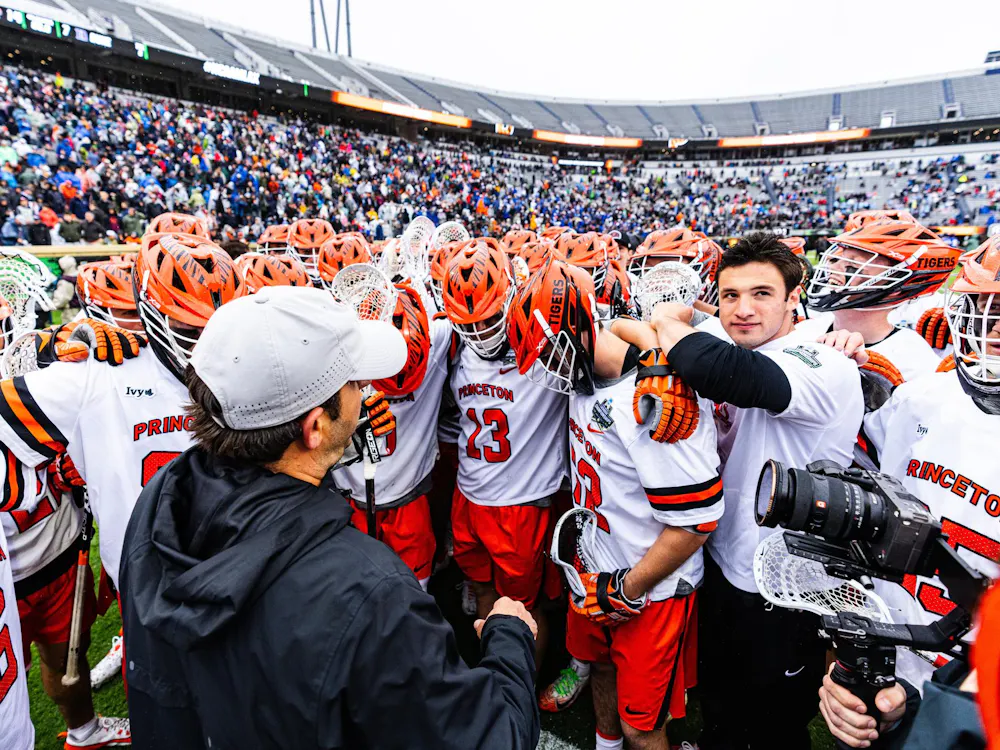
The wait is over: No. 1 men’s lacrosse roars past Notre Dame to secure first national title since 2001
Hayk Yengibaryan and Cadigan PerrielloWith the win, the Tigers captured the program’s seventh overall title and its first since 2001. After erasing an early 3–0 deficit, the Tigers scored 11 unanswered goals en route to a 16–9 win in Charlottesville, Va.
With the win, the Tigers captured the program’s seventh overall title and its first since 2001. After erasing an early 3–0 deficit, the Tigers scored 11 unanswered goals en route to a 16–9 win in Charlottesville, Va.
Croddick leads No. 1 men’s lacrosse past Duke, will play two-seed Notre Dame on championship Monday
Hayk YengibaryanThe Tigers will play the two-seeded and No. 3 ranked Notre Dame in the title game on Memorial Monday, seeking their first championship in 25 years.
The Tigers will play the two-seeded and No. 3 ranked Notre Dame in the title game on Memorial Monday, seeking their first championship in 25 years.