


In light of the Supreme Court’s recent decision on affirmative action, renewed scrutiny has fallen upon other pathways to Princeton admission, particularly legacy admissions.
Princeton considers the children or stepchildren of graduate and undergraduate alumni to be legacy applicants. According to data from Princeton in 2018, over 30 percent of applicants with a legacy connection are admitted, compared to less than five percent overall. This does not necessarily mean that a legacy applicant is six times more likely to be admitted than an identical non-legacy applicant since the demographics of legacies are significantly different from the applicant pool as a whole.
The data we collected shows that legacy students are more white than the class as a whole, with significantly less Asian and Black representation than among non-legacy students. The wealth gap is even larger, with substantially more legacy students from high-income backgrounds. Survey data also shows, however, that legacy students have higher SAT scores, even when controlled by income, higher Princeton GPAs, and are more likely to go into nonprofit or public service professions.
We examined data from the Class of 2026 Frosh Survey to examine the demographics and incoming statistics of legacy students and the Class of 2023 Senior Survey to analyze their trajectories through Princeton and their post-graduation plans.
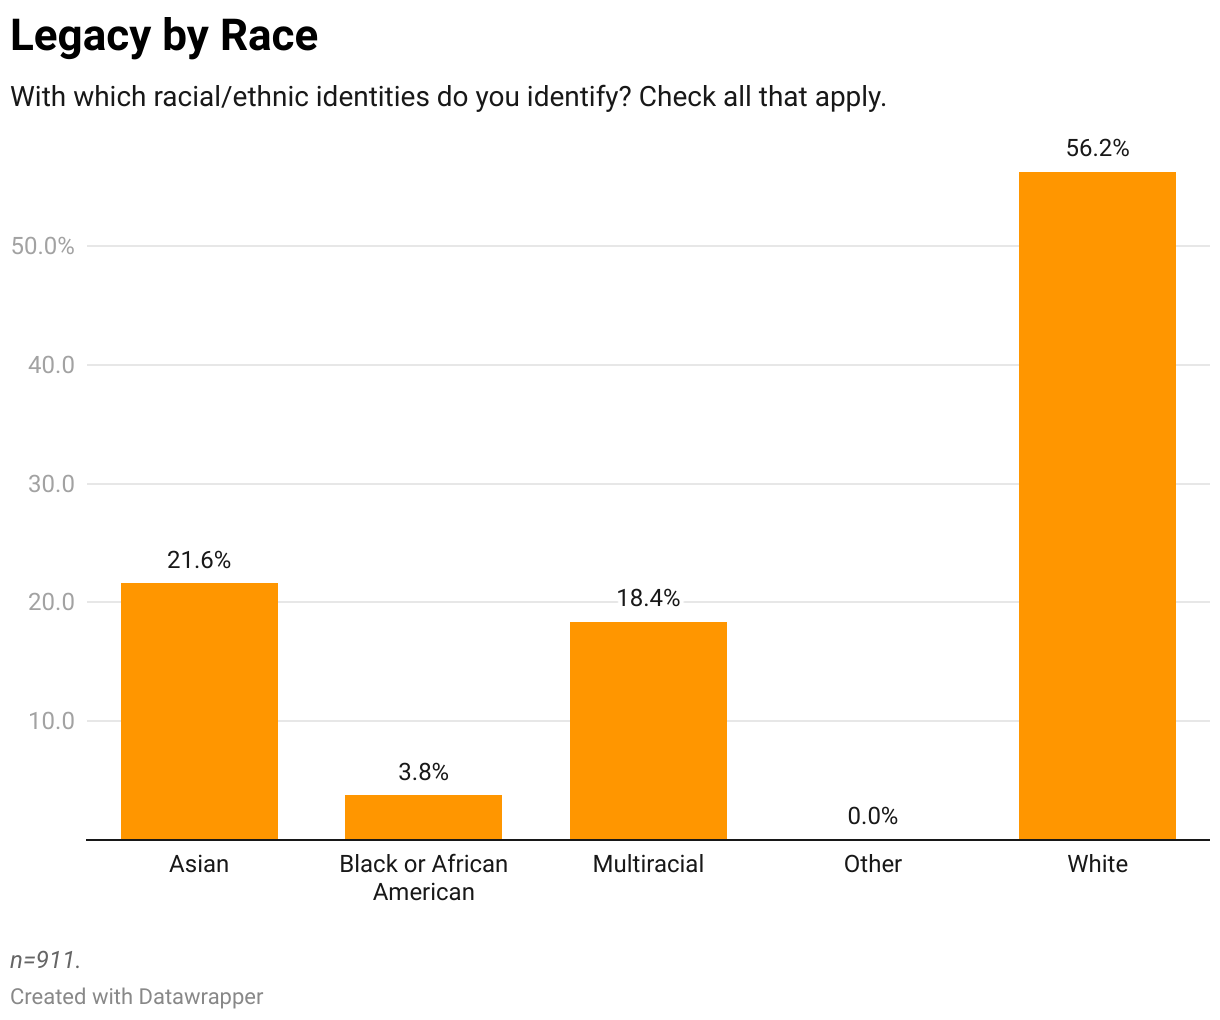

According to the survey responses, a majority of legacy students in the Class of 2026, 56 percent, are white, while fewer than five percent are Black and about 20 percent are Asian. Among non-legacy students, just 43 percent are white, while ten percent are Black and nearly 35 percent are Asian. Far more non-legacy students are Black or Asian than their legacy counterparts.
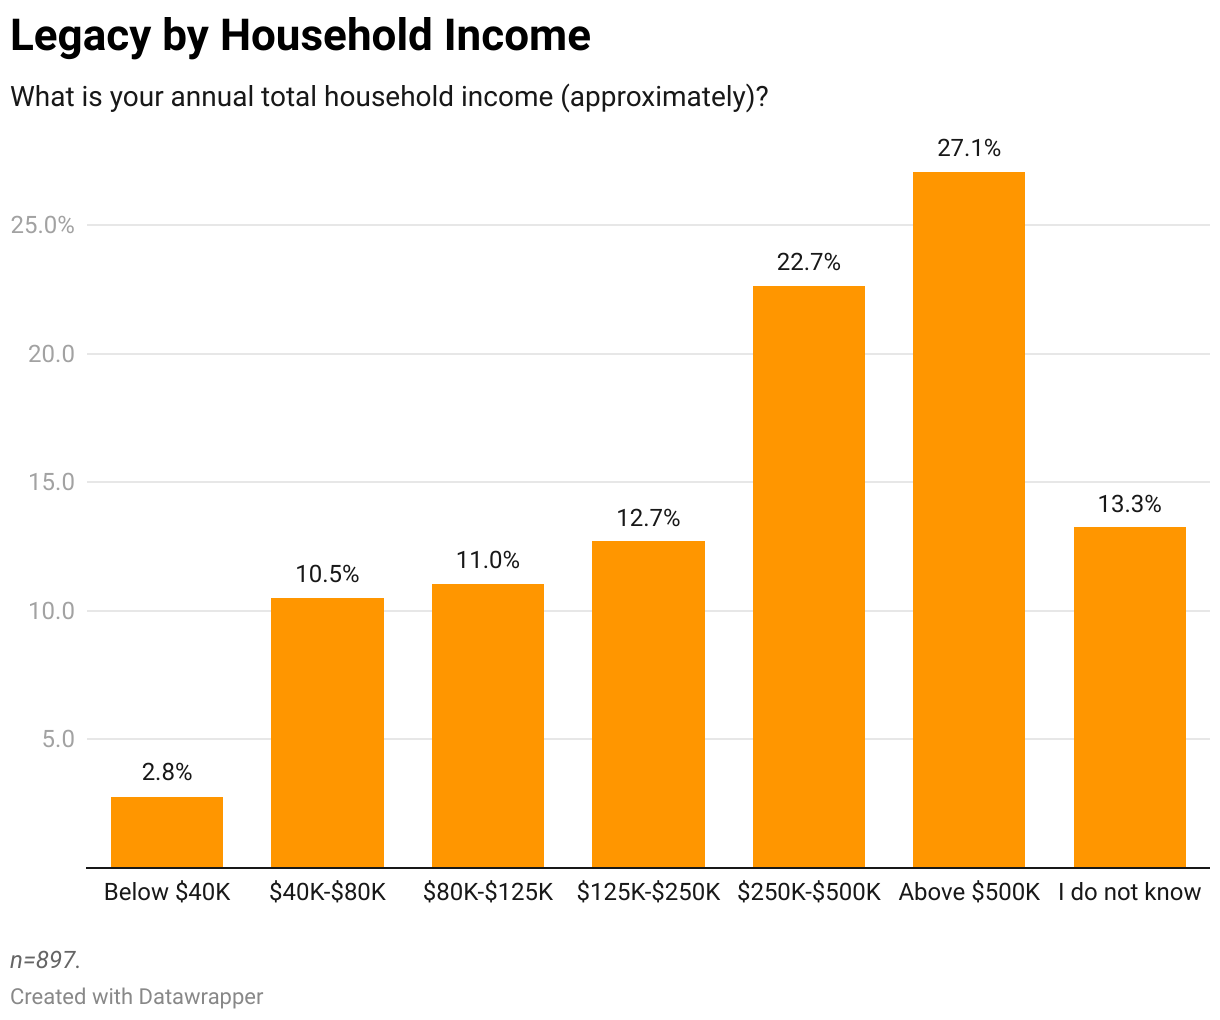
The impact on income is significantly more dramatic. Almost half of legacy students come from households that made above $250,000 a year compared to less than a quarter of non-legacy students. Just 2.8 percent of legacy students came from households with incomes less than $40,000 a year compared to over 18 percent for non-legacy students.
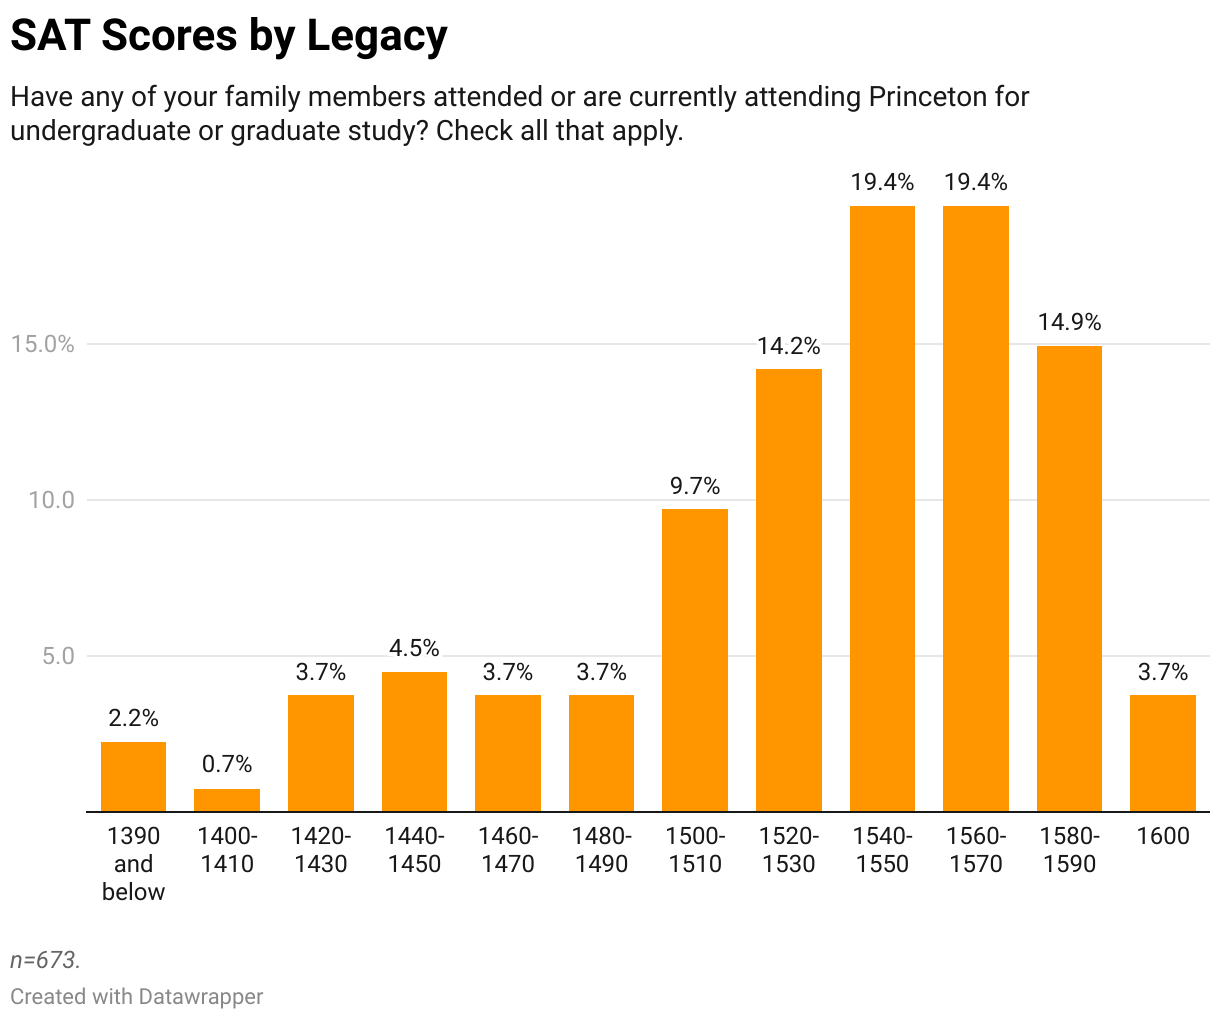
A lot of the discussion surrounding legacy students has focused on the advantage in admissions. Based on self-reported SAT scores from the Class of 2026 Frosh Survey, legacy students had higher SAT scores, with 38 percent having had a score higher than 1550, compared to 32.5 percent of nonlegacy students, and 2.2 percent having had below 1390 on the standardized test, compared to 12.8 percent of non-legacy students.
Other, more holistic, aspects of the application process are harder to measure and it is unclear whether the trend carries across other factors of the admissions process.

Legacy students, as we’ve seen, are in significantly higher socioeconomic brackets, which studies have tied to SAT performance. Based on the Frosh Survey data, within each income bracket, legacy students still have higher scores than non-legacy students at the same income level. The differences were fairly constant across all income brackets, with the median SAT score being between zero and 40 points higher for legacies compared to non-legacies.
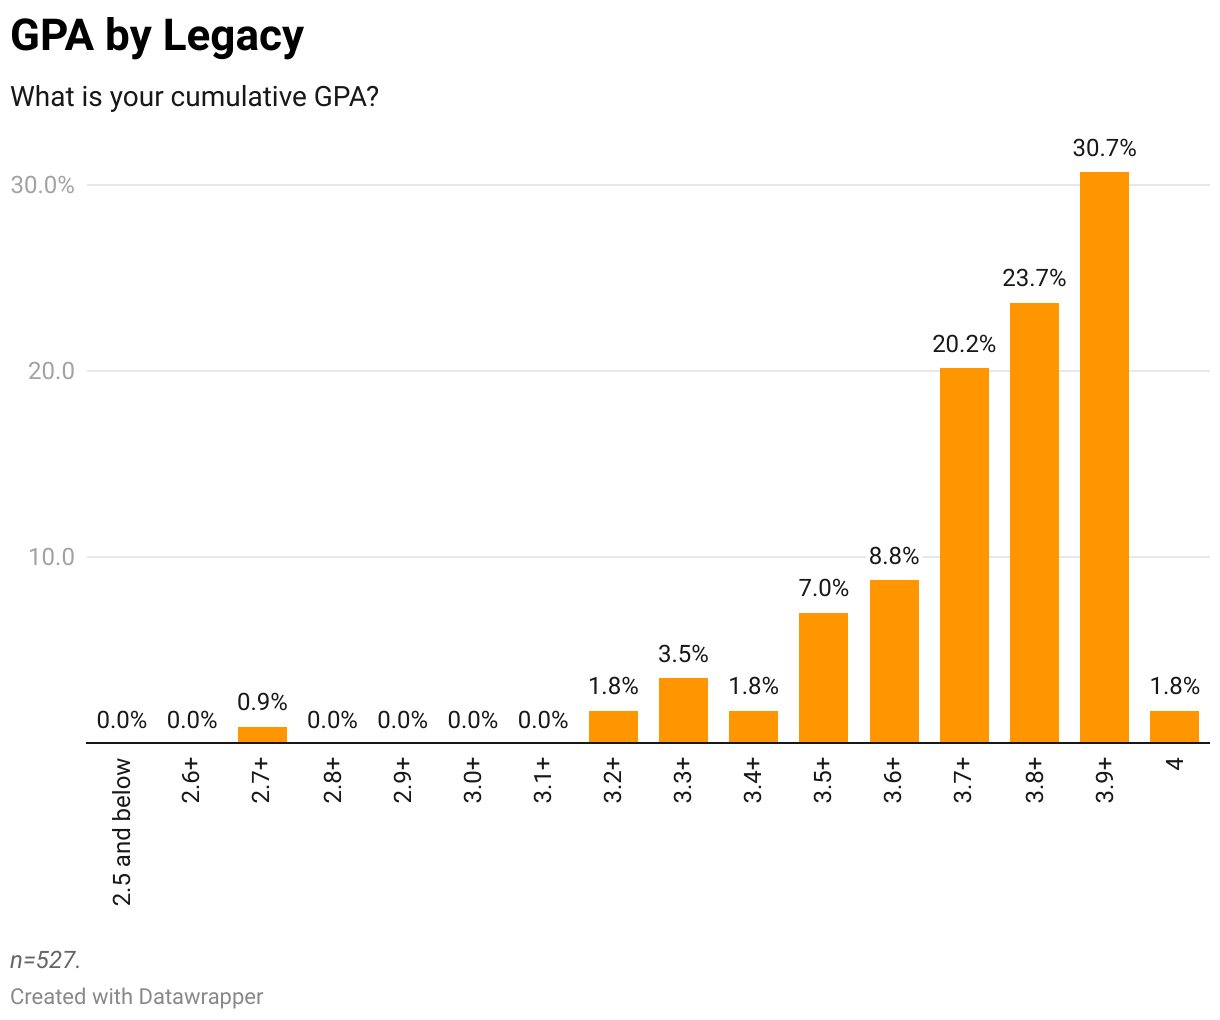
Graduating seniors who had a legacy connection had higher GPA’s while at Princeton as well. According to the 2023 Senior Survey, over three-quarters of legacy students finished with a GPA of 3.7 or above, with less than 60 percent of non-legacies accomplishing the same feat. Eight percent of legacy students graduated with a GPA of less than 3.5, with this number rising to 18 percent among non-legacy students.
GPA at Princeton is not as correlated with income level, but nonetheless, the trend persists in most income brackets. The difference was most pronounced for students coming from households making between $80,000 and $125,000 a year, where the median GPA for legacy students was 3.81 compared to just 3.62 for non-legacies coming from the same socioeconomic background. Effects across other income brackets were less stark; the median GPA of legacy students ranged from 0.02 to 0.11 grade points higher than non-legacies. Only among the wealthiest students did non-legacies perform better. Among students coming from households making over $500,000 a year, non-legacies had a median GPA of 3.74 compared to 3.7 among legacies.
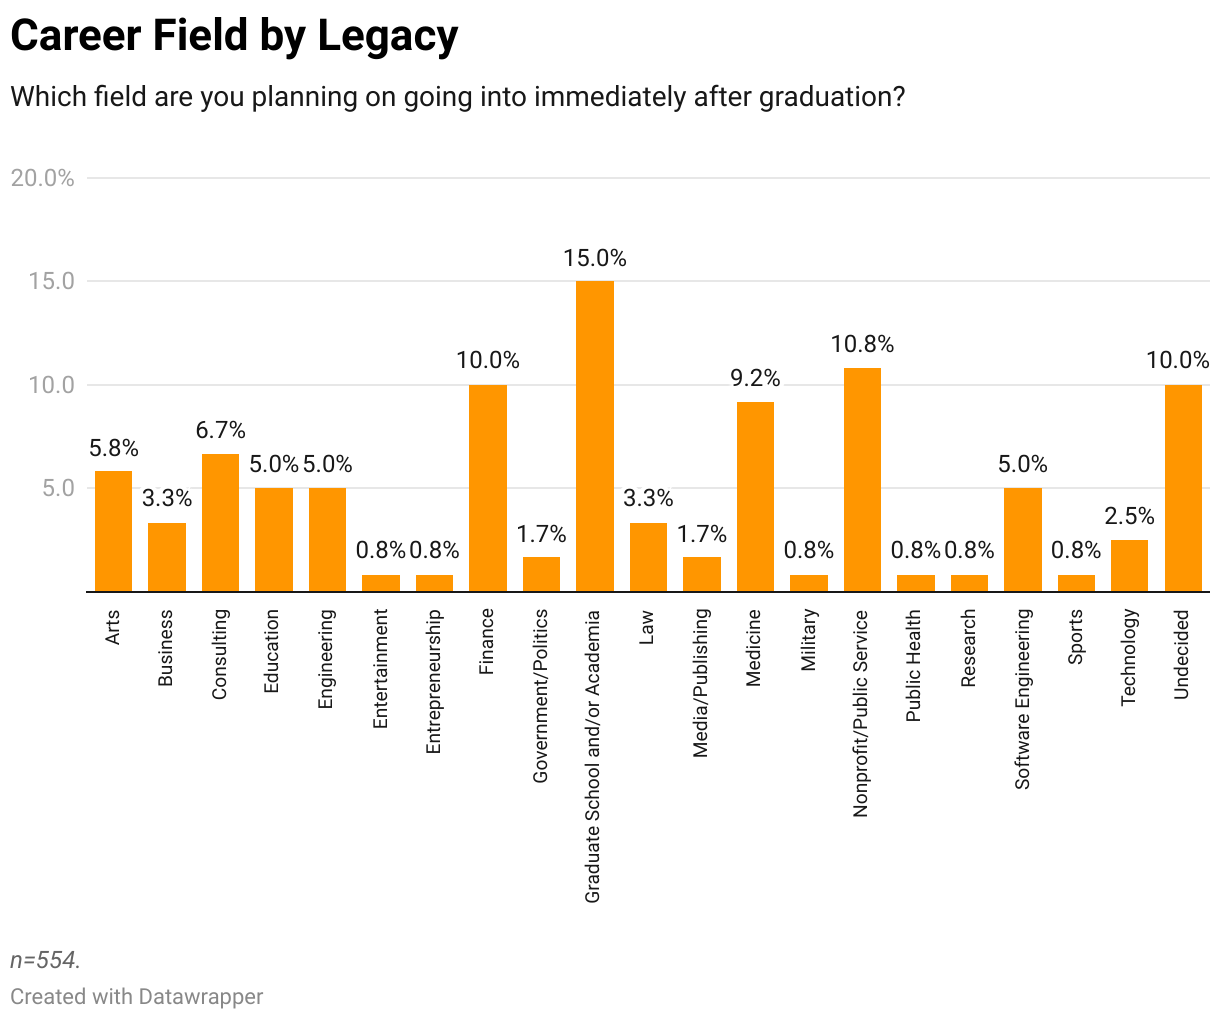
When looking at career paths after Princeton, legacy students chose to start their careers in the nonprofit or public service sectors at higher rates than non-legacies. About 11 percent of legacies listed “Nonprofit/Public Service” as their post-graduation plan, with less than five percent of non-legacies choosing the same option. Conversely, over 20 percent of non-legacies indicated they would be heading to graduate school or academia, with just 15 percent of legacy students choosing the same option. Similar numbers of legacy and non-legacy students, about 10 percent, said they were going into finance.
Statistics show that the elimination of legacy admissions likely would result in an increase in racial and socioeconomic diversity. But the data contests the notion that legacy admits underperform their peers before college, during college, and in pursuing societally-beneficial post-college plans.
Elaine Huang is a head Data editor for the ‘Prince.’
Ryan Konarska is an associate Data editor for the ‘Prince.’
Please send corrections to corrections[at]dailyprincetonian.com.
Read More

Princeton researchers deny allegations that 2004 climate paper was ‘significantly shaped’ by oil executives
Sena ChangA ProPublica and Drilled investigation alleged BP executives helped shape a widely cited 2004 Princeton climate paper that popularized carbon capture, a claim the authors dispute. The report has renewed criticism of Princeton’s ties to the fossil fuel industry.
A ProPublica and Drilled investigation alleged BP executives helped shape a widely cited 2004 Princeton climate paper that popularized carbon capture, a claim the authors dispute. The report has renewed criticism of Princeton’s ties to the fossil fuel industry.

New data and AI unit quietly absorbs five research units, costing survey research director his job
Nico David-FoxEdward Freeland, Princeton’s survey research director, lost his job when the University folded his center into a broader push to consolidate its data and AI efforts. Some faculty say the reorganization was handled with little transparency or consultation.
Edward Freeland, Princeton’s survey research director, lost his job when the University folded his center into a broader push to consolidate its data and AI efforts. Some faculty say the reorganization was handled with little transparency or consultation.
Undergraduate cyclist struck by University employee sues for damages
Haeon LeeThe student, who was seriously injured, is suing the University, the employee, and the owner of the vehicle for damages.
The student, who was seriously injured, is suing the University, the employee, and the owner of the vehicle for damages.