


An analysis of campus crime data for the past seven years by The Daily Princetonian revealed that a plurality of campus crimes occur in the Frist Campus Center. Petty theft is the most common incident on campus followed by harassment.
Since 2016, the Department of Public Safety (DPS) has published daily crime logs of campus incidents in accordance with the Clery Act. Established in 1990, the Clery Act requires all universities that participate in federal student aid programs to publish daily crime logs — updated for 60 days after their posting — that must be accessible to students and staff. Daily crime logs must include the date and time of incidents, classification, relative area, as well as crime dispositions. The act also requires universities to publish a report each year by Oct. 1 that contains crime statistics from the previous three years for the University and adjoining areas.
The ‘Prince’ analyzed over 3,000 of these crime logs ranging from Jan. 1, 2016 to Nov. 8, 2022, compiling a near-comprehensive dataset of campus crime for that time period. While robust, the data does not include incidents directly adjacent to campus nor the number of people involved, leading to potential undercounting.
In addition to the daily crime logs, the ‘Prince’ reviewed annual security and fire reports as well as New Jersey State Police’s Uniform Crime Report dating back to 2016.
Despite a decreased case load, DPS is resolving crimes at a lower rate within the first 60 days, according to their daily reports
For the past seven years, campus crime has peaked in accordance with the school year. Thefts, for example, typically spike during May, the month when a high number of alumni flock back to campus for Reunions, and September, when students first move in. During these months, harassment and other major forms of crime appear consistently among the data. July and December, months with relatively few students on campus due to academic breaks, had the lowest crime levels.

From 2016 to 2022, the period for which data is available, 9.38 incidents occurred per week — roughly 1.3 crimes per day on average. Crimes most frequently occurred between 11 p.m. and 12 a.m.
The number of incidents has been trending down since 2016, COVID-19 notwithstanding. Between 2016 and 2019, the daily crime logs indicated that cases dropped by 20 percent. The ‘Prince’ was unable to further verify this trend.

Despite a decreased case load, DPS is resolving crimes at a lower rate within the first 60 days, according to their daily crime logs. Nearly 145 cases were cleared in 2018, representing 30 percent of incidents. In 2021, DPS cleared just 63 cases, representing 17 percent of incidents.
The majority of cleared cases are administratively “closed” — an official but ambiguous term stated in the crime logs — but the count also includes those that end in arrest or judicial referral.
These logs are only updated up to 60 days after their entry. Therefore, cases cleared after the first two months are not reflected in these numbers.
In an email to the ‘Prince,’ University Spokesperson Michael Hotchkiss cited the Uniform Crime Report (UCR) — an annual crime report submitted to the N.J. State Police — as a more reliable source for tracking clearance rates.
“The daily crime log is not designed to be used to track statistics on clearance rates, in part because the case status is only updated for 60 days after an entry is posted,” Hotchkiss wrote.
Despite the limited time scale, the ‘Prince’ chose to investigate the daily crime logs because they provide a rare glimpse into the timeline with which DPS investigates cases. The drop in these cleared cases means the speed with which DPS is clearing cases has fallen over the past seven years. However, as a consequence of the 60-day limit, the ‘Prince’ was unable to ascertain the overall percentage of on-campus crimes which are eventually cleared.
The UCR reports a different clearance rate from the daily crime log, and the number is trending upward. According to the UCR, clearance rates increased, from six percent in 2018 to 14 percent in 2020.
This difference is due both to the 60-day window featured in the daily crime report, and the fact that the UCR counts fewer types of crime. The UCR, for example, does not track petty theft or harassment, crimes which make up a majority of those listed in the daily crime log.
What crimes are committed where?
The majority of violations of policy involve liquor and drugs, which are prohibited in specific instances on campus. The daily crime logs — which contain relatively few drug and liquor violations — do not reflect these offenses, as most happen directly adjacent to campus and therefore, are recorded as incidents in the annual report but not the daily logs.
“Once a year, neighboring jurisdictions report arrests that occur immediately adjacent to our campus,” Hotchkiss reported.
“Neighboring jurisdictions” includes Prospect Avenue, the street on which the 11 eating clubs are located. As the clubs are not officially a part of campus, an incident involving illegal consumption of alcohol at an eating club, for example, would show up in the annual report, but not the daily crime log.
The key distinction in the reporting mechanisms is likely explained by the responding agency in the cases of off-campus liquor and drug violations. Those in the crime logs represent a response by DPS officers, while annual reports include both DPS and Princeton Police Department responses.
Of the crimes happening on campus, thefts (including scooters, golf carts, and computers) are the most common, followed by harassment and criminal mischief. Criminal mischief is a misdemeanor that includes property damage, recklessness, and endangerment. All have trended downward with the total cases, from 2016 until today, according to the daily logs.
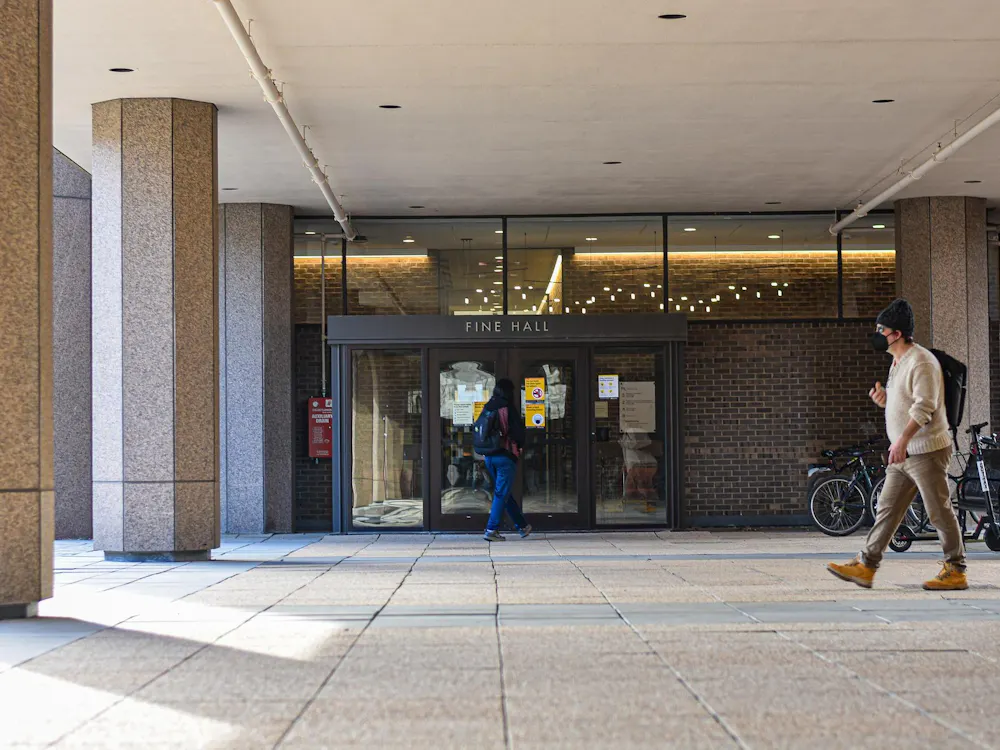
Better visualizing the crime categories on campus, the chart below contains all the crime categories committed at Frist over the past seven years.
Frist is the leading location of crime — with 142 incidents since 2016 — followed by Lawrence Apartments, Princeton Stadium, and Dillon Gymnasium.
Crime at housing complexes contribute nearly one-third of all incidents, led by upperclass and graduate housing. Forbes and First College have the lowest rates of crime reported.
Arrests are most common at Princeton Stadium and adjacent areas including Jadwin and McDonnell Halls — mainly trespassing violations. In 2019, there were 38 arrests on campus, led by drug law violations. Other common reasons for arrests include theft and disorderly conduct..
A disclaimer regarding the data
Crime statistics vary widely between the different sources of data. Every report has different criteria for crime reported, and the full picture is hard to construct with such wide variances in numbers. The data in this article was derived principally from the daily crime logs, published on the DPS website. Entries with “unknown” or missing dates or times were not included in the dataset.
Hotchkiss noted in an email to the ‘Prince’ that these logs “include the most activity of the three reporting sources,” referencing the annual security reports, the daily crime logs, and the UCR. But crimes involving drugs and alcohol, which disproportionately happen at off-campus locations like eating clubs, aren’t represented when Princeton Township Police respond.
Furthermore, the data in these logs is far from precise, commonly containing spelling mistakes and other errors. The ‘Prince’ incorporated all complete data, and some incidents with missing information were omitted.
Editor’s note: This article has been updated to reflect that while DPS experienced a decreased case load, between 2018 and 2021, fewer crimes were resolved within the first 60 days, according to their daily logs.
Additionally, language around the UCR clearance rate was updated to ensure accuracy.
Marc Lessler is a first-year data contributor from Brooklyn, N.Y. He focuses on campus crime and public records reporting. Please direct any correction requests to corrections[at]dailyprincetonian.com.
Read More

NJ AI Hub marks first anniversary with inaugural startup cohort
Zihan (Frank) XuFourteen selected start-ups receive weekly workshops, reverse pitches, corporate introductions, among other guidance over 12 weeks. The “AI accelerator” helps to test each company’s technology and fast-track its path to commercialization.
Fourteen selected start-ups receive weekly workshops, reverse pitches, corporate introductions, among other guidance over 12 weeks. The “AI accelerator” helps to test each company’s technology and fast-track its path to commercialization.
Three Princeton alumni awarded 2026 Fields Medal
Clara DochertyThe three alumni who received the medal are Yu Deng GS ’15, John Pardon ’11, and Jacob Tsimerman GS ’11.
The three alumni who received the medal are Yu Deng GS ’15, John Pardon ’11, and Jacob Tsimerman GS ’11.

How Charles Plohn ’66 brought his classmates together on the shelves
Nikki HanFor decades, Charles J. Plohn, Jr. ’66 has been collecting books published by members of his class. With nearly 700 titles in this collection, Plohn is attempting to find his library a permanent home.
For decades, Charles J. Plohn, Jr. ’66 has been collecting books published by members of his class. With nearly 700 titles in this collection, Plohn is attempting to find his library a permanent home.