


In Ice Cube’s “It Was a Good Day,” his basketball prowess is explained by referencing the standard statistics of points, rebounds and assists. But, as in baseball, basketball has been in the process of an intellectual revolution, with new sophisticated metrics aimed at representing a player’s value to his team as accurately as possible while expanding beyond the still useful but limited and context-driven statistics that have existed for years. As you have probably guessed, I will describe some of these new statistical measurements.
Player Efficiency Rating: This all-encompassing statistic, developed by ESPN’s statistical guru John Hollinger, attempts to reduce the entire measurable contribution of a player to one number. The exact formula is too complicated to replicate on this page if I hope to write about anything else, but it boils down to assigning credit for positive accomplishments (three-pointers, rebounds, assists, blocks, etc.) and demerits for negative ones (turnovers, missed free throws, etc.), adjusting for playing time and team pace (because players whose teams play faster have more opportunities to accumulate stats) and normalizing the league average to 15. Critics charge that PER gives too little credit to defensive specialists who lock down top scorers without producing much on the offensive end (such as Shane Battier or Thabo Sefolosha) and too much credit to high-volume shooters who may not produce as much in other areas (such as Monta Ellis or Nick Young), but it is so accessible that it’s an easy statistic with which to start a debate and accurate enough that it usually doesn’t suggest anything too absurd. It also provides handy benchmarks, such as having a PER between 25 and 30 virtually guarantees MVP consideration, whereas if a player’s PER is in single digits he’d better be the second coming of Dikembe Mutombo or Gary Payton on the defensive end, or his NBA days are numbered. The all-time leader in PER is, of course, Michael Jordan.
True Shooting Percentage: San Antonio Spurs backup power forward Matt Bonner has a shooting percentage of .484. New York Knicks center Ronny Turiaf has a shooting percentage of .636. Sure sounds like Turiaf has been a more effective shooter, right? But we’re leaving out an absolutely crucial component. Virtually all of Turiaf’s shots are two-point shots taken close to the basket while Bonner’s primary role is as a floor-spacer, with over 60 percent of his shots taken from behind the three-point line. Clearly, then, Bonner’s shots tend to have a smaller probability of success and result in more points. TS percentage accounts for this. The idea is similar to shooting percentage but also accounts for free throws and three-point shooting (if a player never made any free throws or three-pointers, his True Shooting Percentage and regular shooting percentage would be identical). When all of those factors are added in, Bonner’s TS percentage jumps to .651, virtually identical to Turiaf’s .650. This statistic helps properly account for the values of spot-up shooters such as Bonner, Boston’s Ray Allen or Miami’s Eddie House, most of whom get their points in large portion from three-point shots and, therefore, have lower field goal percentage than inside players such as Shaquille O’Neal or Dwight Howard. It also punishes poor foul shooters and rewards good ones; Dwight Howard and Al Horford have very similar TS percentage despite Howard’s higher field goal percentage because Horford is significantly better at shooting free throws.
Usage Rate: Usage rate combines minutes played, shot attempts, assists and turnovers to form an estimate of the percentage of team plays in which a player is involved while he is on the floor. This statistic is most helpful for constructing a team dynamic, helping distinguish between players who need a lot of possessions and have offenses constructed around them (Kobe Bryant, LeBron James, Carmelo Anthony, Ellis, etc.), players whose contributions come almost solely on defense and don’t need to be involved in offense (Joel Przybilla, Ben Wallace and Sefolosha), and efficient scorers who mostly shoot open-assisted shots without creating much for themselves (Allen, James Jones and Channing Frye). This is why some argue that the New York Knicks should not trade for Anthony. Carmelo is a phenomenal player, but both he and Amare Stoudemire have among the highest usage rates in the league and are not known for their effort on defense. The players that the Knicks would have to trade, such as Landry Fields and Wilson Chandler, don’t have the pedigrees or statistics of Anthony, but they work harder on defense and use fewer possessions. Usage rate is basically about how the whole is not always exactly the sum of its parts, whether greater or smaller. There is, after all, only one ball.
There are many more of these newfangled statistics on ESPN.com and other sites such as 82games.com (Estimated Wins Added, Adjusted Plus-Minus, etc.), but I am, as they say, out of ointment and out of time (meaningless points to whoever gets the reference).
Read More

Princeton rowing sees success in national championship regattas
Leila Eshaghpour-SilbermanAt the national championships this spring, Princeton rowing stood strong against the competition.
At the national championships this spring, Princeton rowing stood strong against the competition.

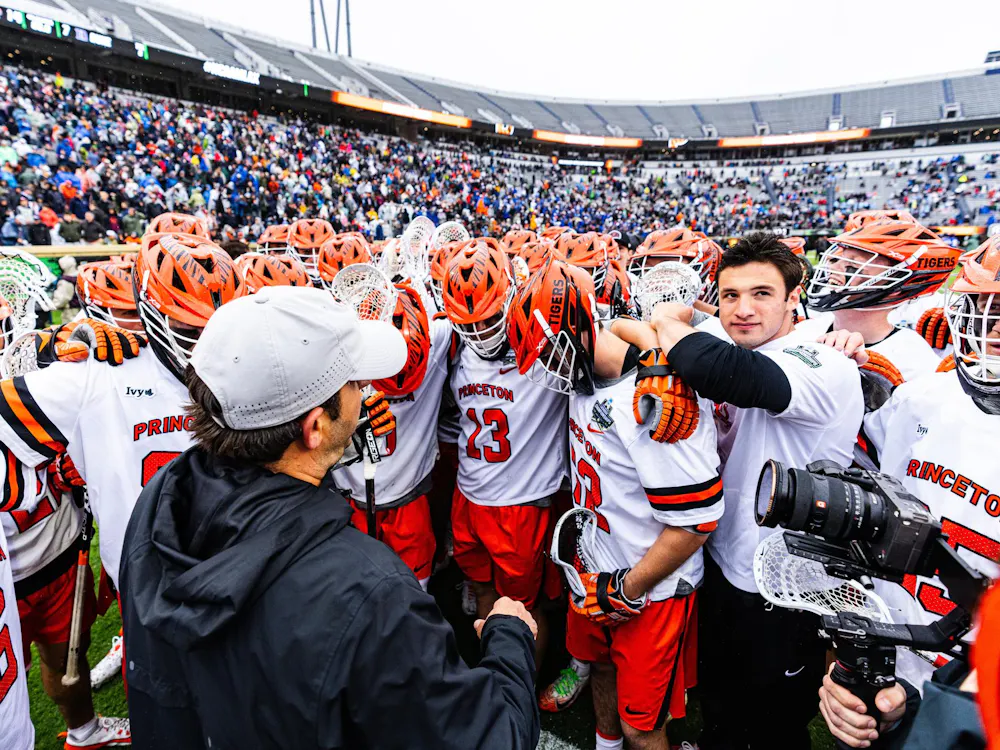
The wait is over: No. 1 men’s lacrosse roars past Notre Dame to secure first national title since 2001
Hayk Yengibaryan and Cadigan PerrielloWith the win, the Tigers captured the program’s seventh overall title and its first since 2001. After erasing an early 3–0 deficit, the Tigers scored 11 unanswered goals en route to a 16–9 win in Charlottesville, Va.
With the win, the Tigers captured the program’s seventh overall title and its first since 2001. After erasing an early 3–0 deficit, the Tigers scored 11 unanswered goals en route to a 16–9 win in Charlottesville, Va.
Croddick leads No. 1 men’s lacrosse past Duke, will play two-seed Notre Dame on championship Monday
Hayk YengibaryanThe Tigers will play the two-seeded and No. 3 ranked Notre Dame in the title game on Memorial Monday, seeking their first championship in 25 years.
The Tigers will play the two-seeded and No. 3 ranked Notre Dame in the title game on Memorial Monday, seeking their first championship in 25 years.