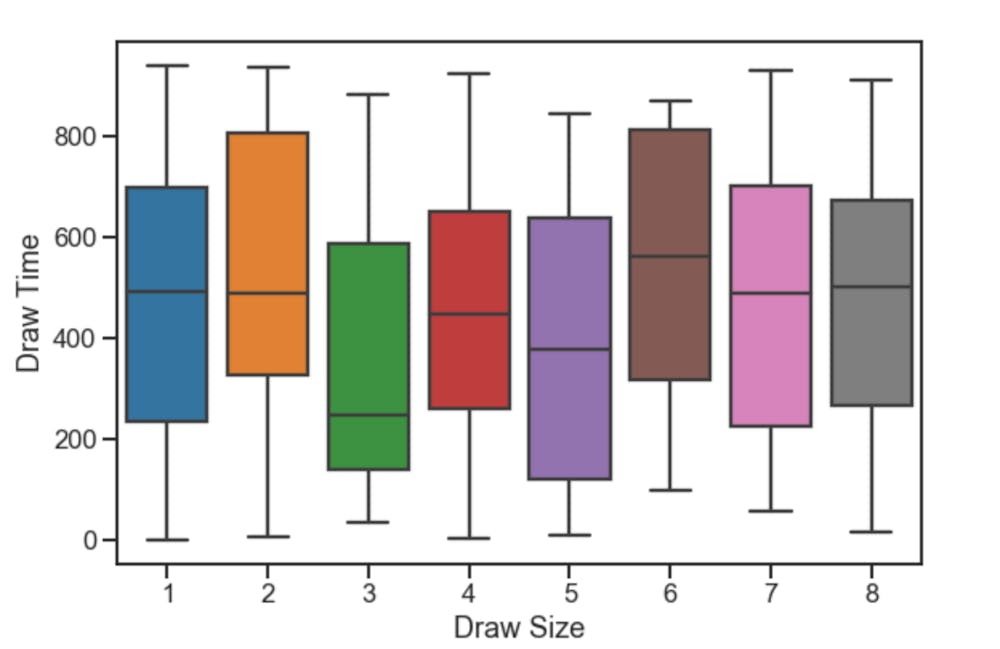
group size vs. draw time.png Box plot showing the distribution of draw times per group size. Photo courtesy of Yang Song ’20
 Solutions by The State News


